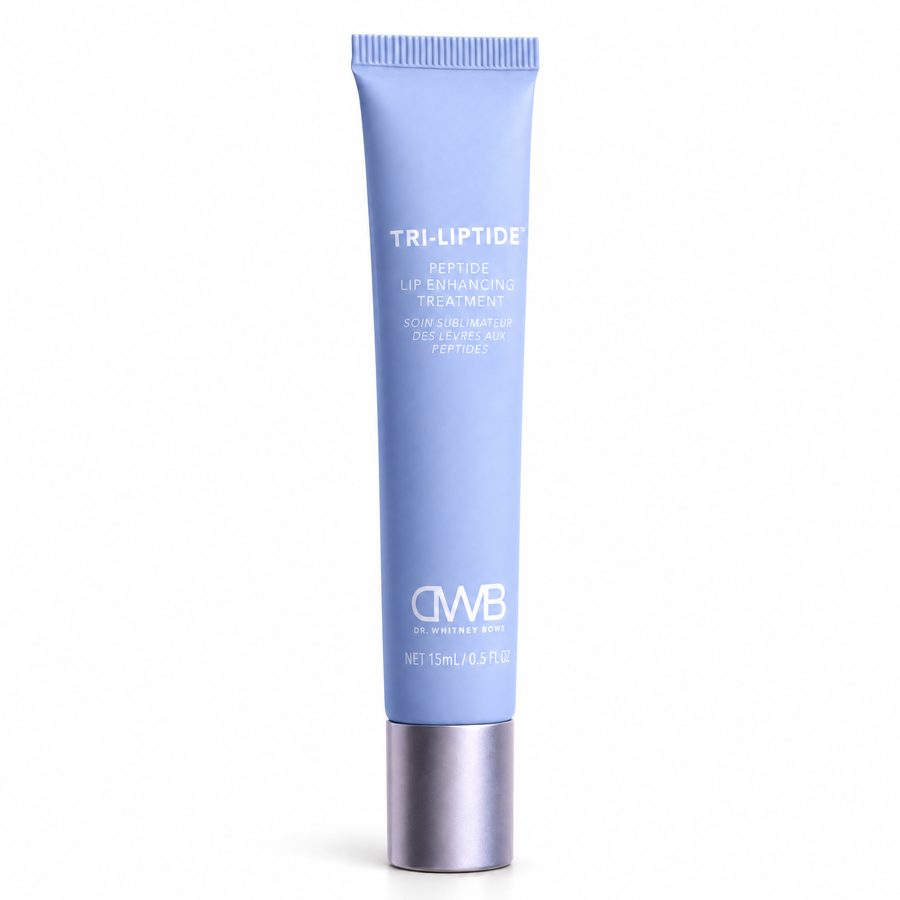
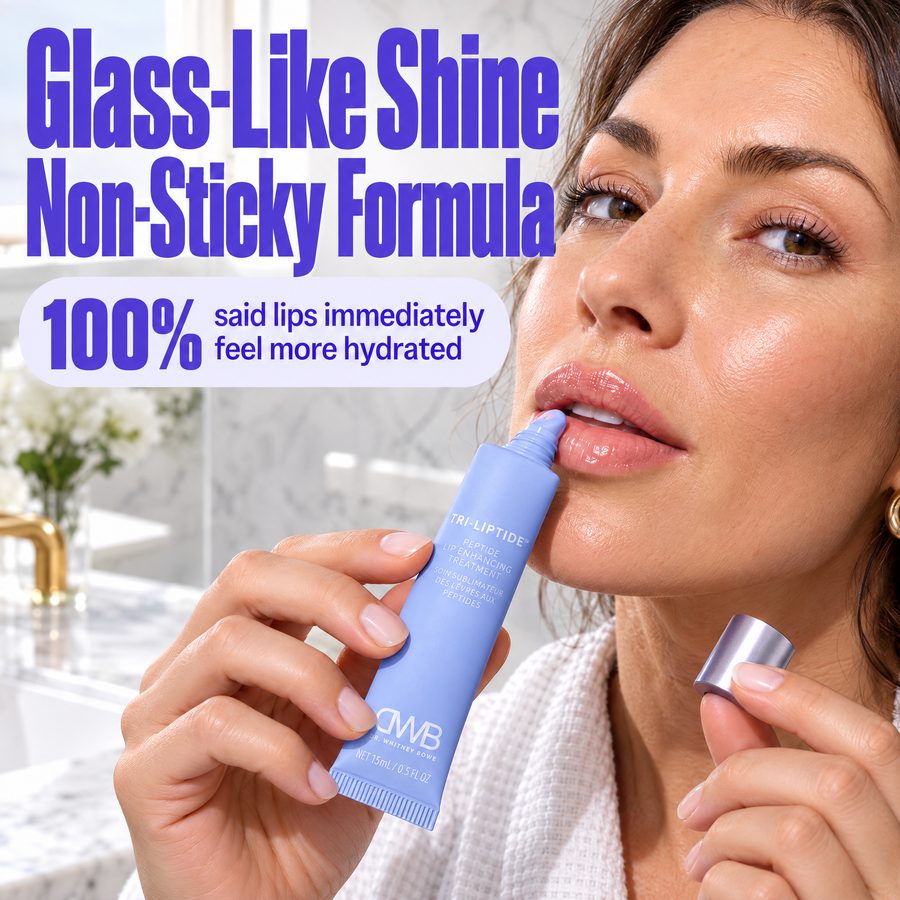
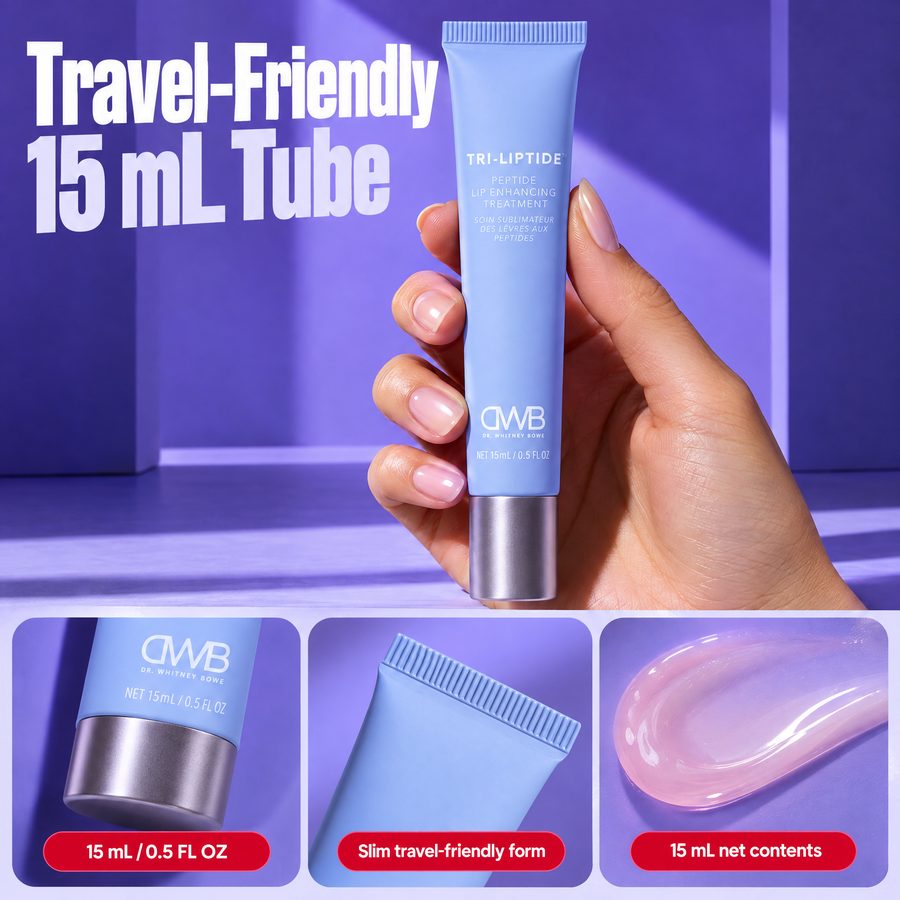
Full Circle pairs true Amazon experts, operators who've built and run 7-figure brands, with cutting-edge AI built on the playbooks from $500M+ in Amazon revenue managed. One team runs your whole channel, so growth stops being a guess.
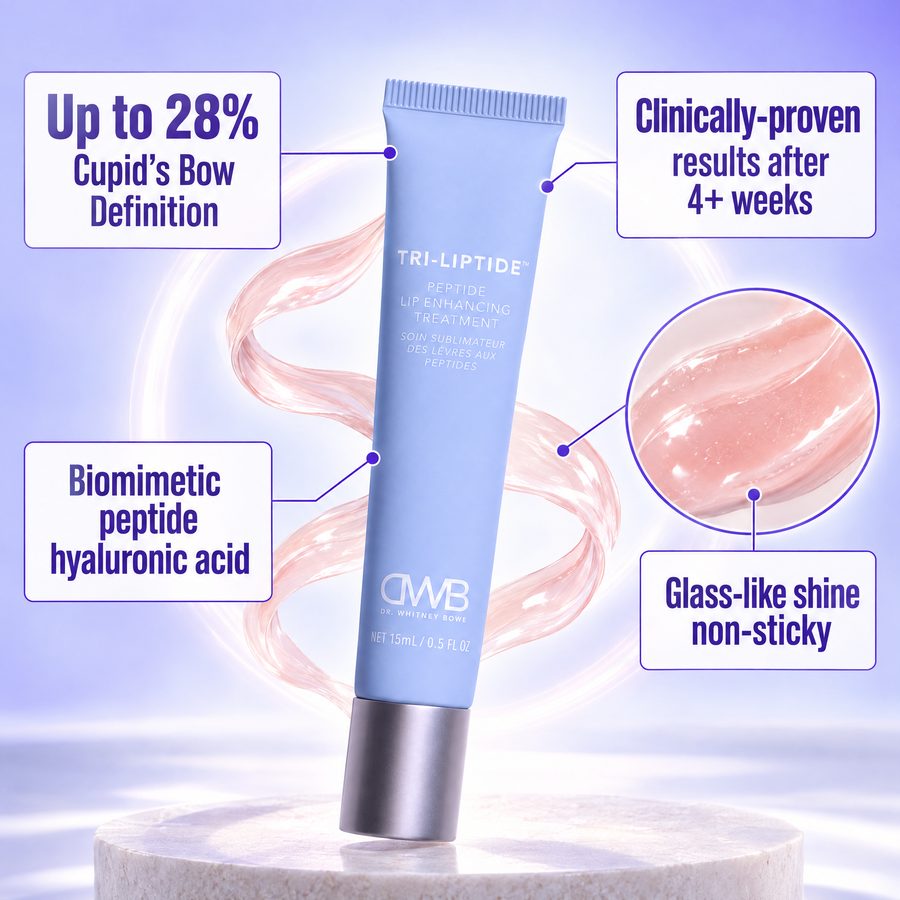
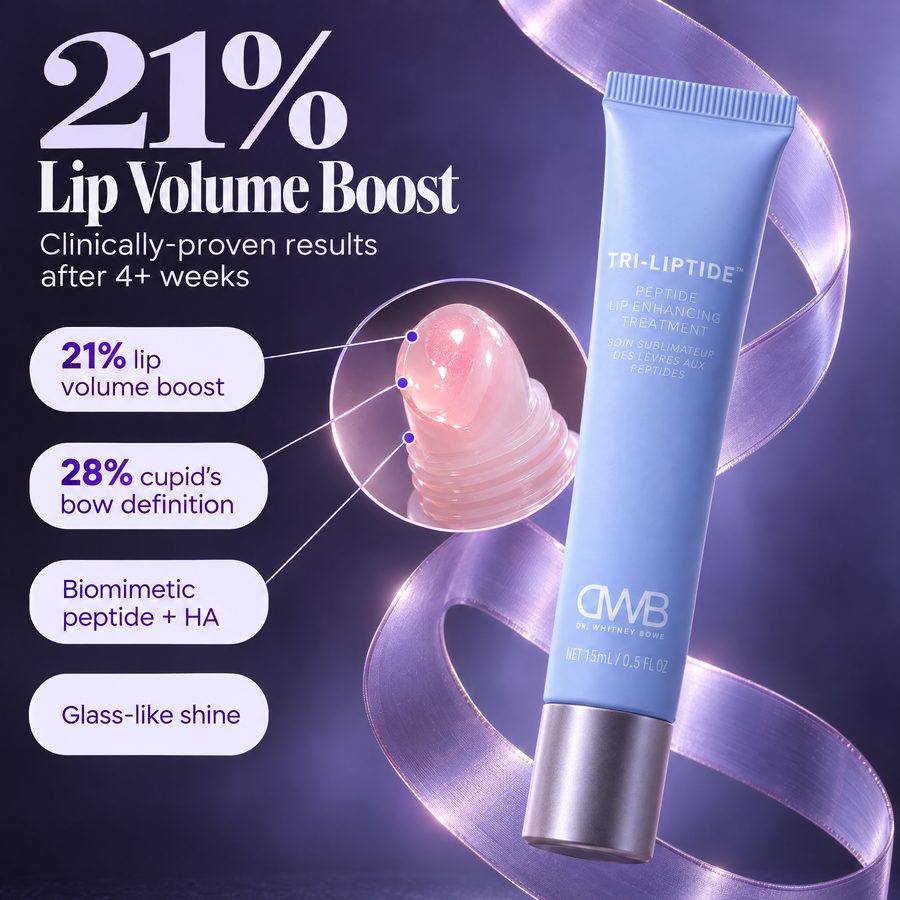
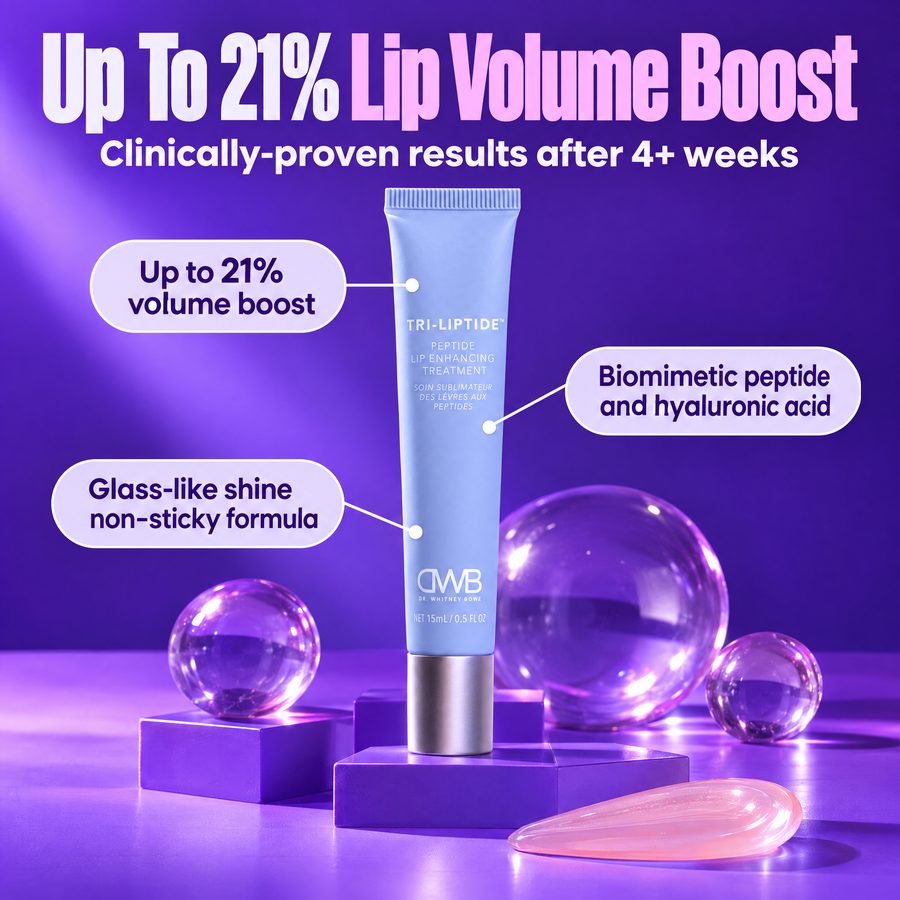
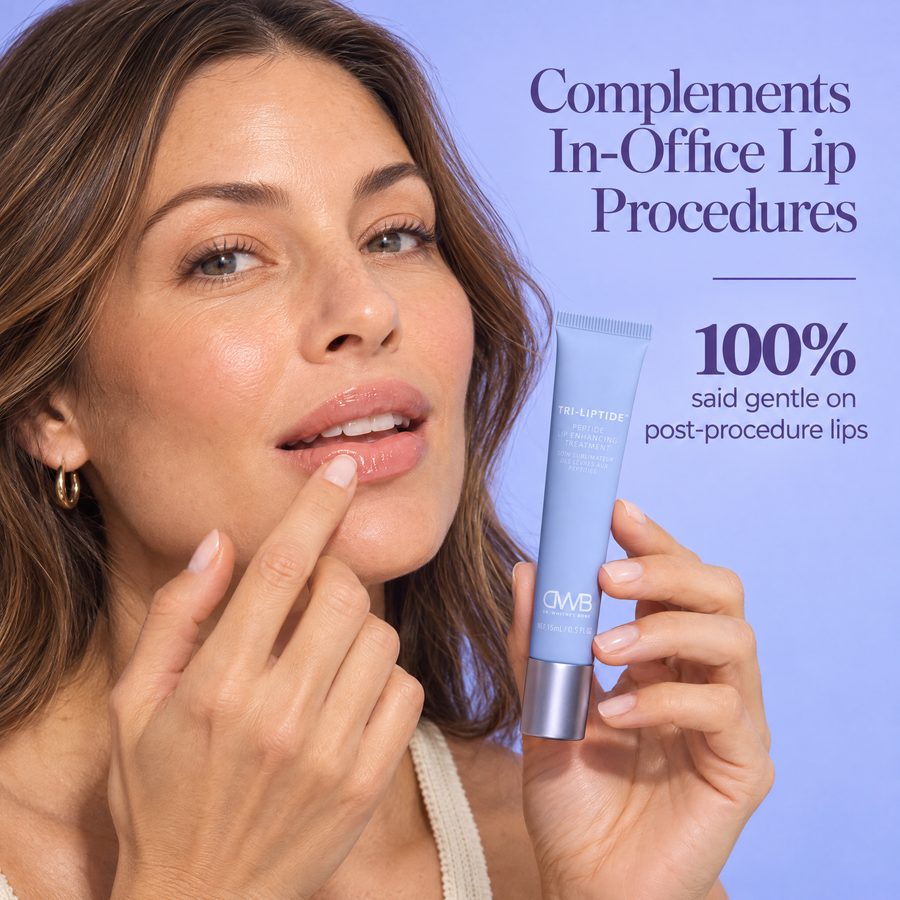
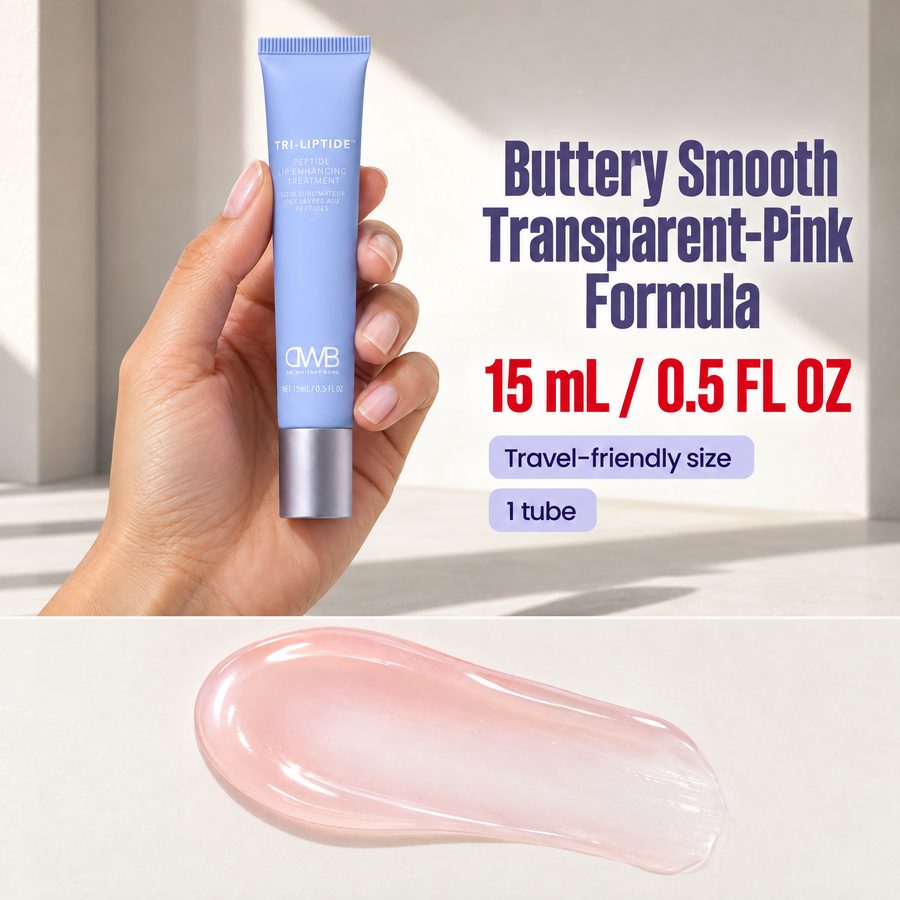
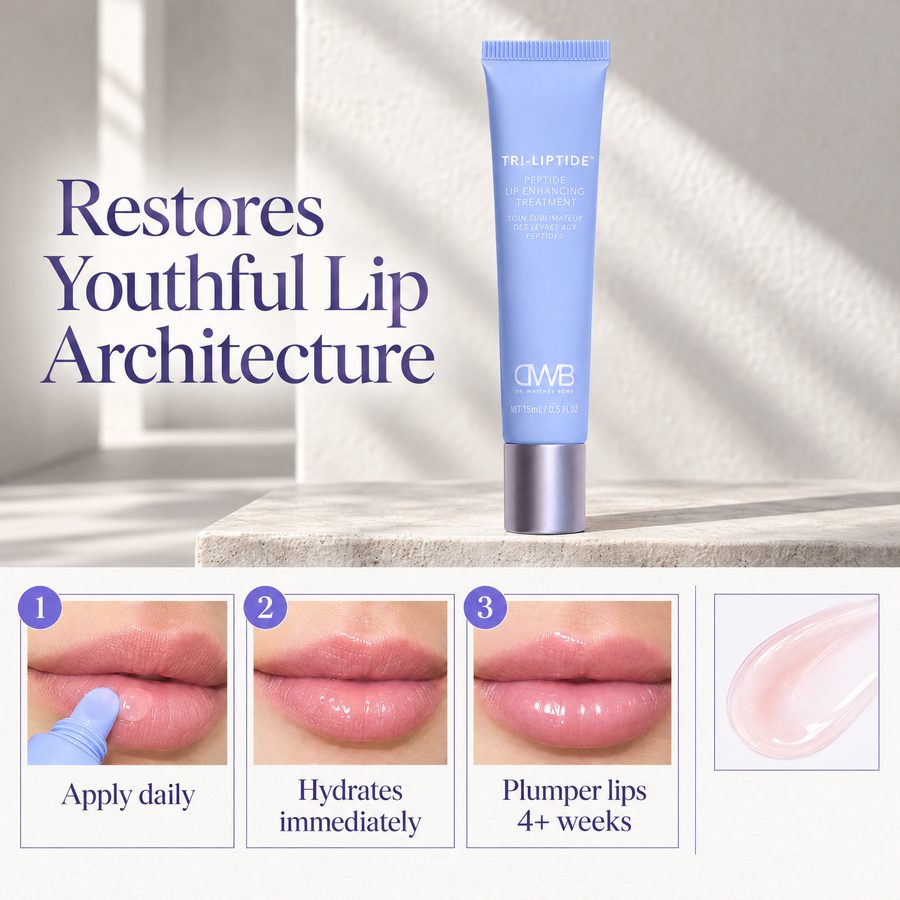
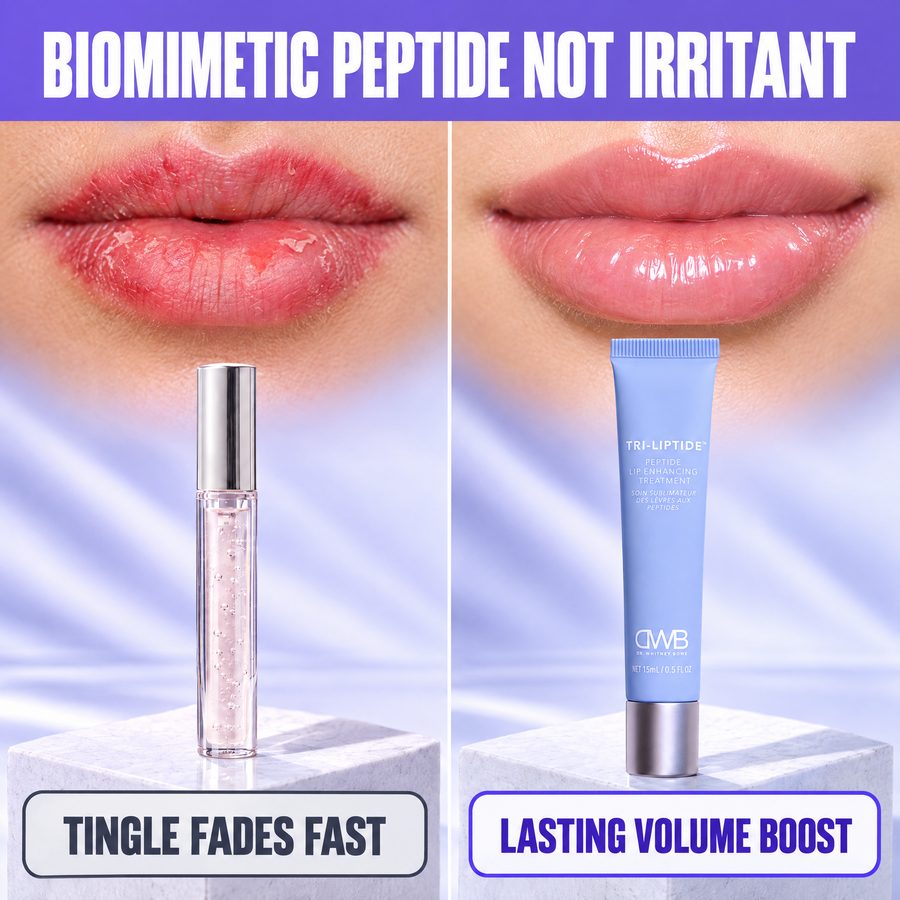
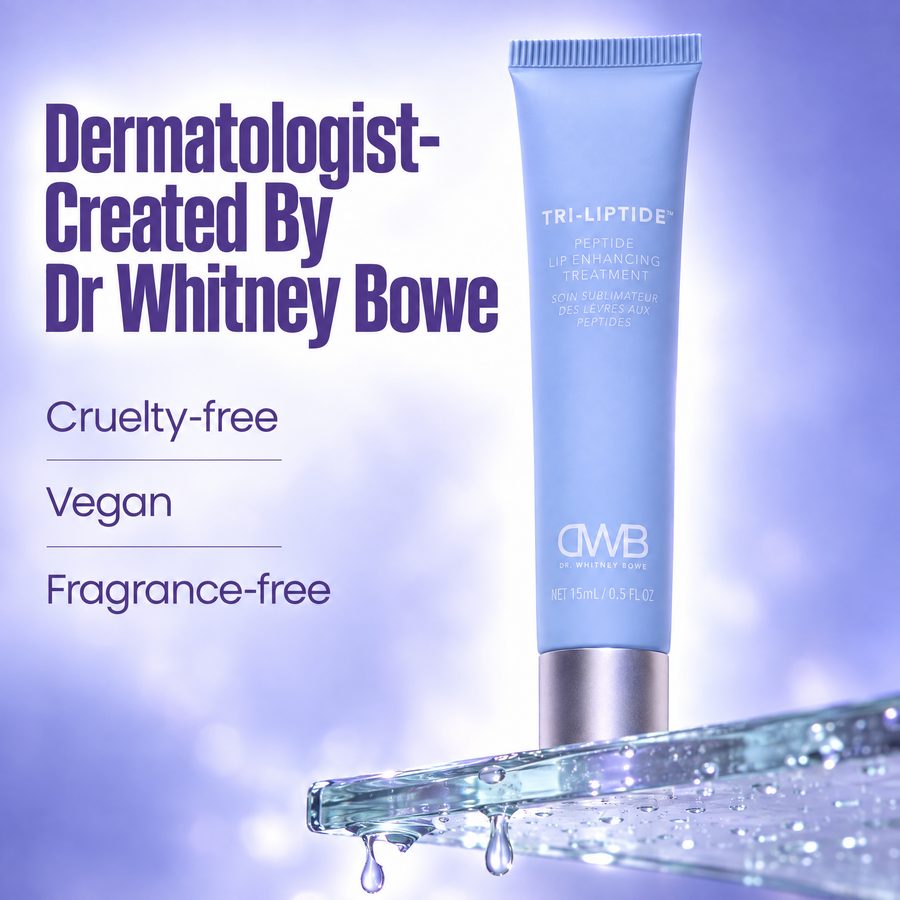
Supplements, cookware, travel, wallets, beauty, grooming, gardening, crafts. Different categories, same job: build an Amazon channel that scales on purpose, not by accident.
+ 100 more brands across supplements, beauty, home, pet, kitchen, outdoor and games
$500M+ in Amazon revenue managed. 100+ brands.
Every lesson from that $500M+ now lives in two places: the experts who run your account, and the AI that works it every day.
+44%
US Amazon sales across the 45 brands we manage
Sep 2025–Aug 2026 vs prior 12 months
How Full Circle works
True Amazon experts. AI built on $500M+.
Most agencies sell you a senior partner, then hand you to a junior coordinator. Most AI tools hand you a chatbot that has never run an Amazon account. We put the two halves together, and that's what makes scale predictable.
01 · The experts
7-figure operators lead your account
Our key account team is led by operators who built or exited 7-figure companies of their own. They own the strategy, the targets and the moments that make your year.
Own your targets and your profit, not a vanity metric
Run Prime Day, Black Friday and launches personally
Make the judgment calls software shouldn't
One named expert who knows your brand cold
Q1 planPrime DayLaunchBFCM
signalsdecisions
02 · The AI
Built on $500M+ of Amazon experience
Ava and Dr. PPC run on cutting-edge AI models, armed with the playbooks and data from $500M+ in Amazon revenue managed. They read your account every day and log the reason for every move.
orbit://activity · example
Your dashboard · Orbit
Everything we see. You see.
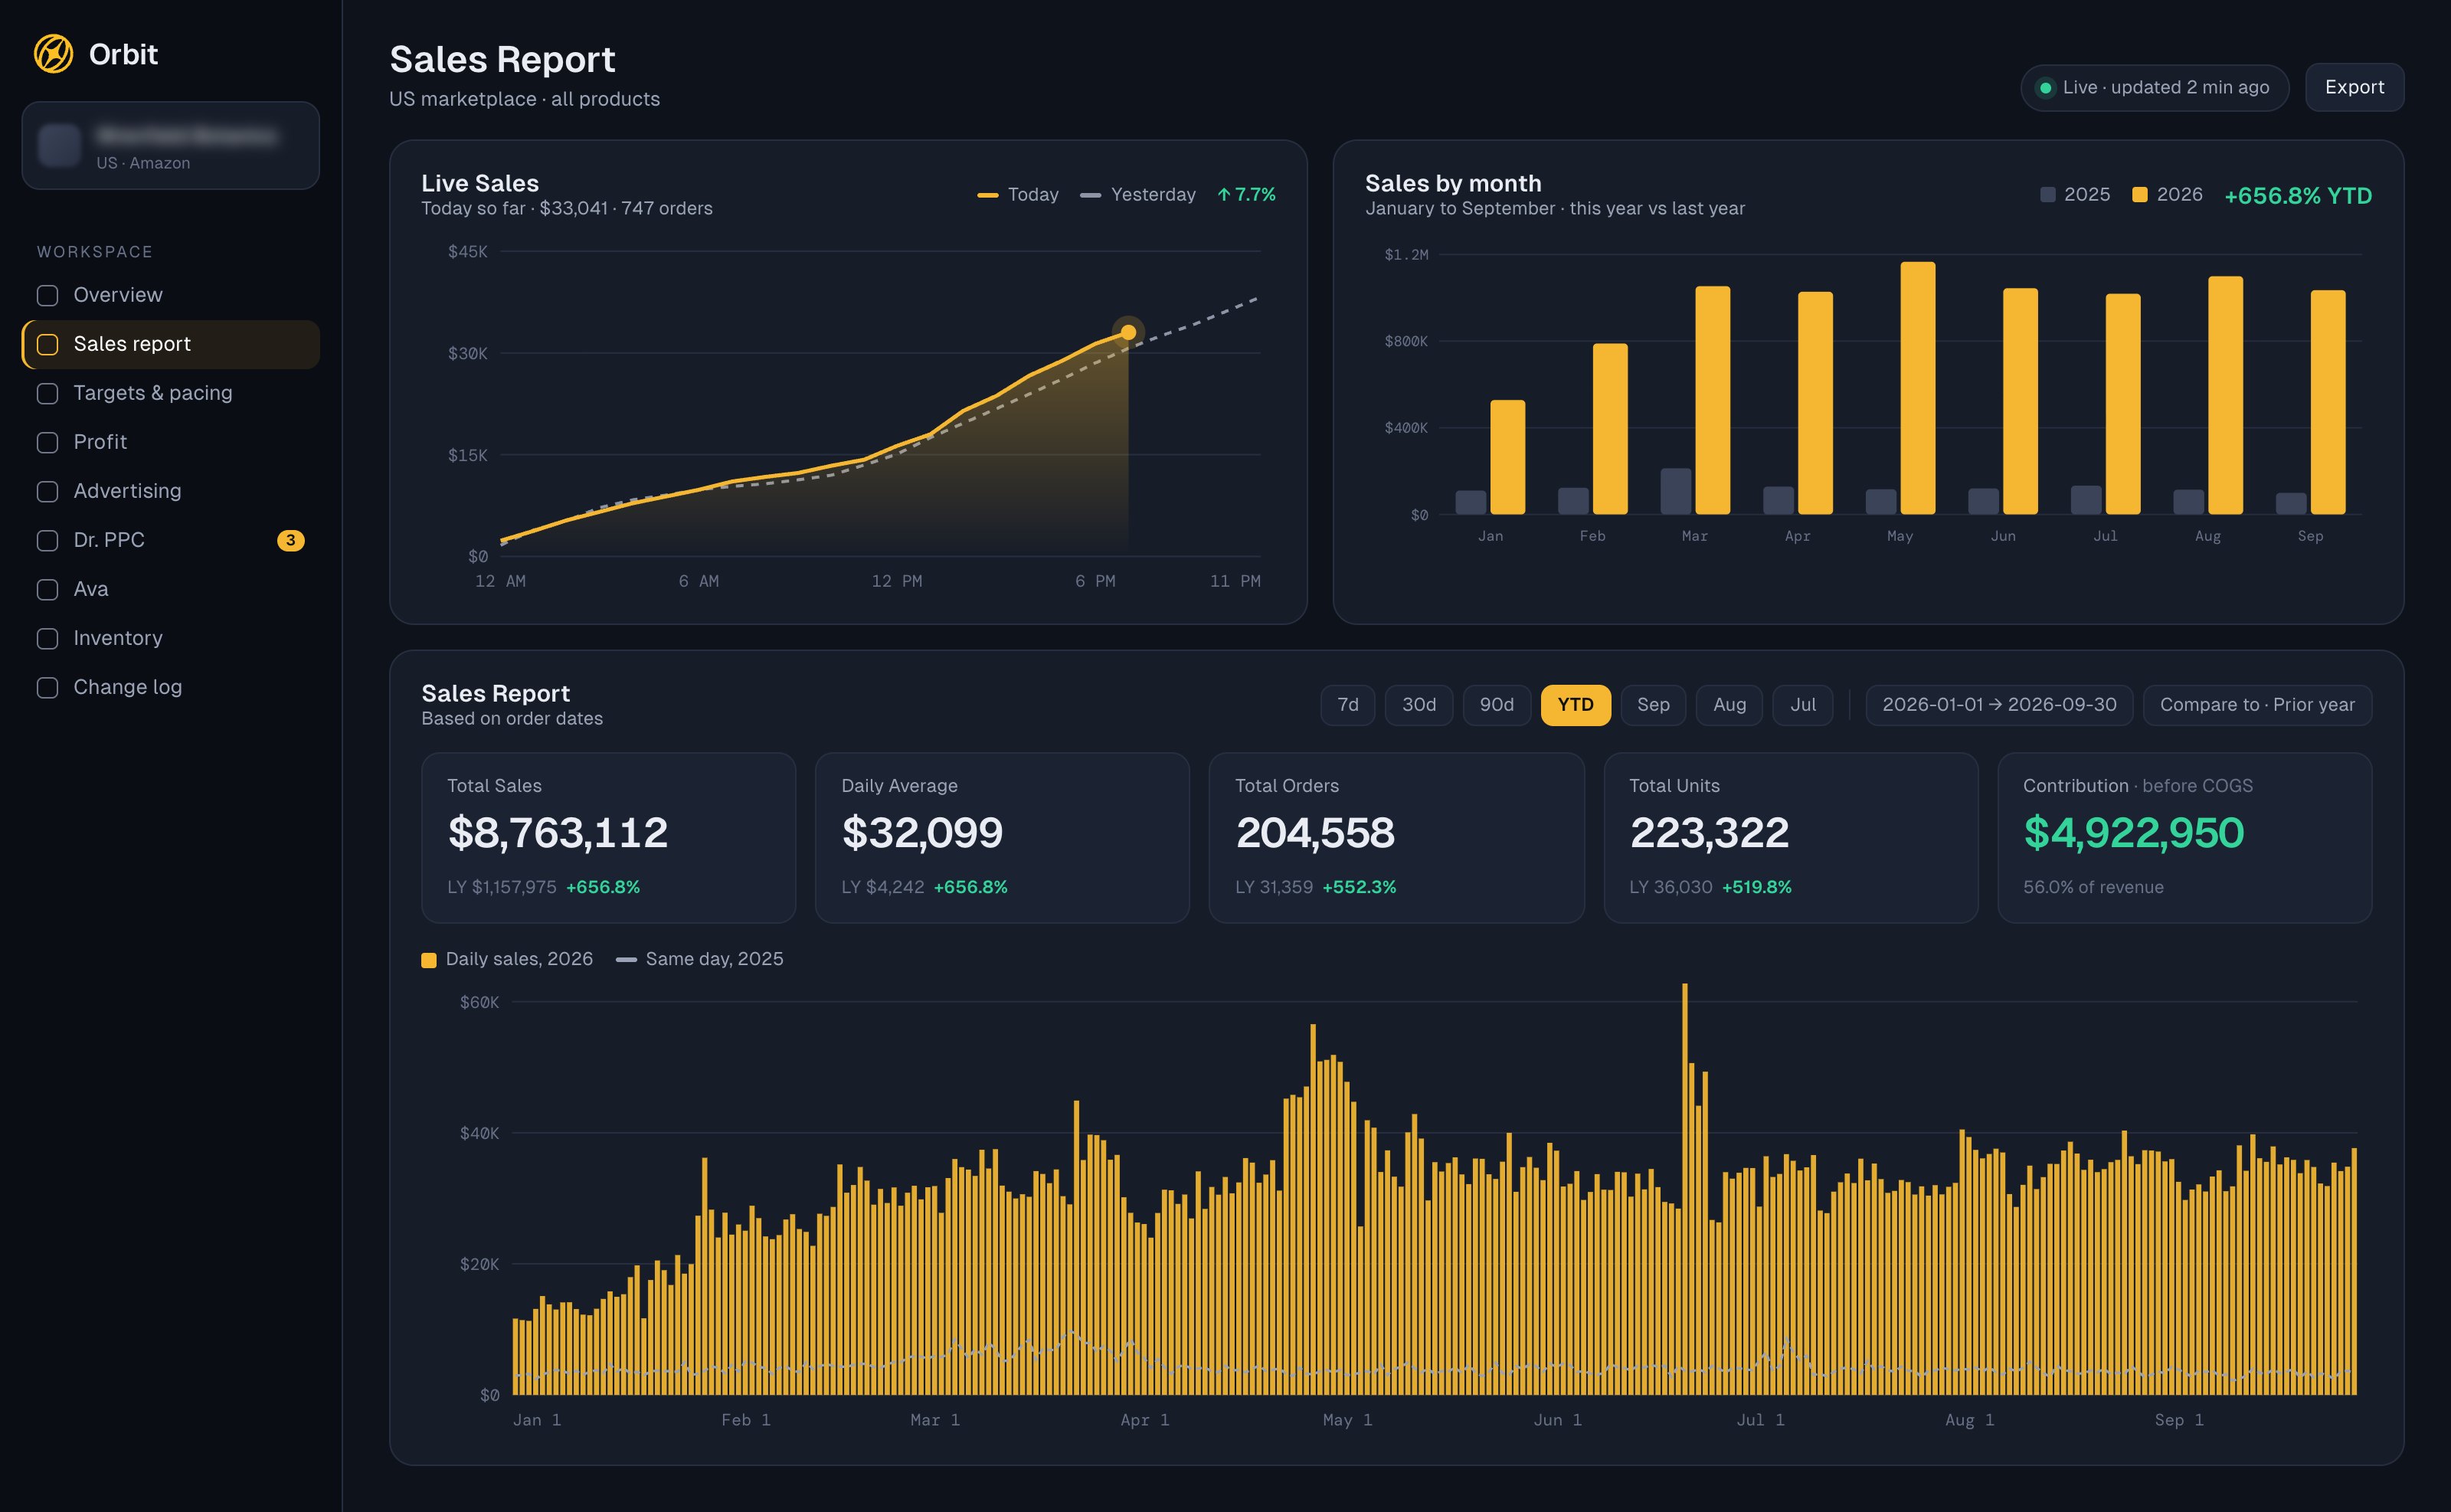
Every Full Circle client gets Orbit: the same live dashboard our experts and AI work from. Sales, profit, pacing to your goal, and every change with the reason behind it. No monthly deck. No black box.
fullcircleorbit.com · Sales reportLive
01 / 07
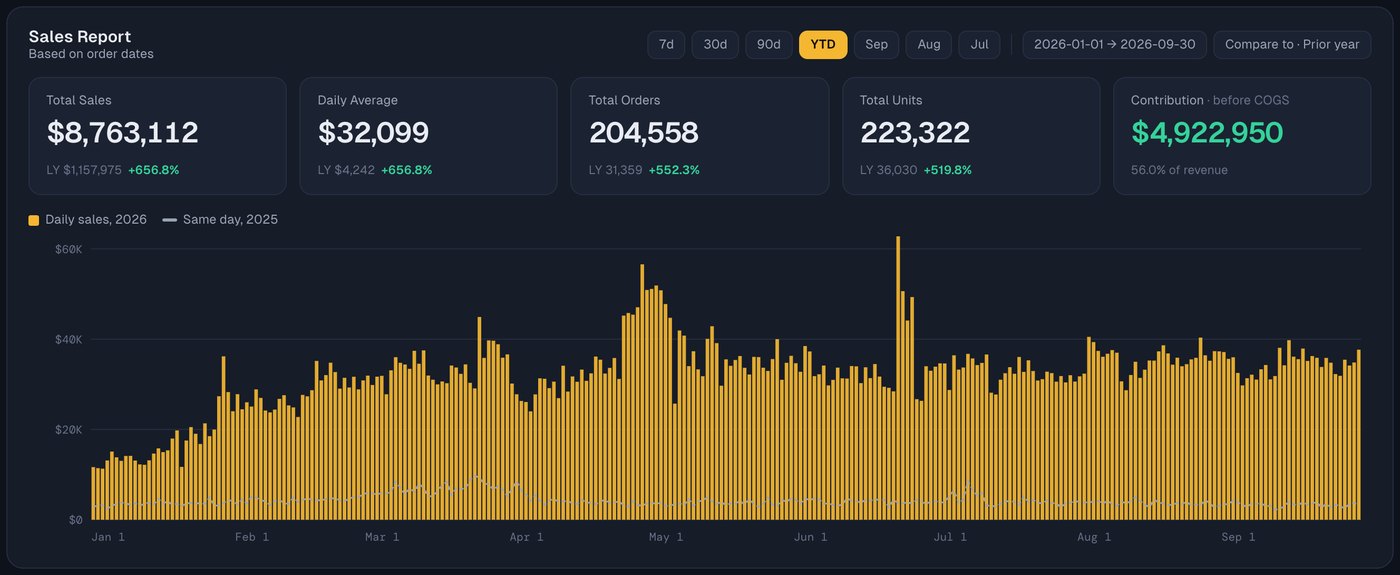
Your whole account, live
The same dashboard our experts and AI work from. Every Full Circle client gets it.
01
Your whole account, live
Sales, orders, units and contribution next to last year, day by day, with a live view of today.
02
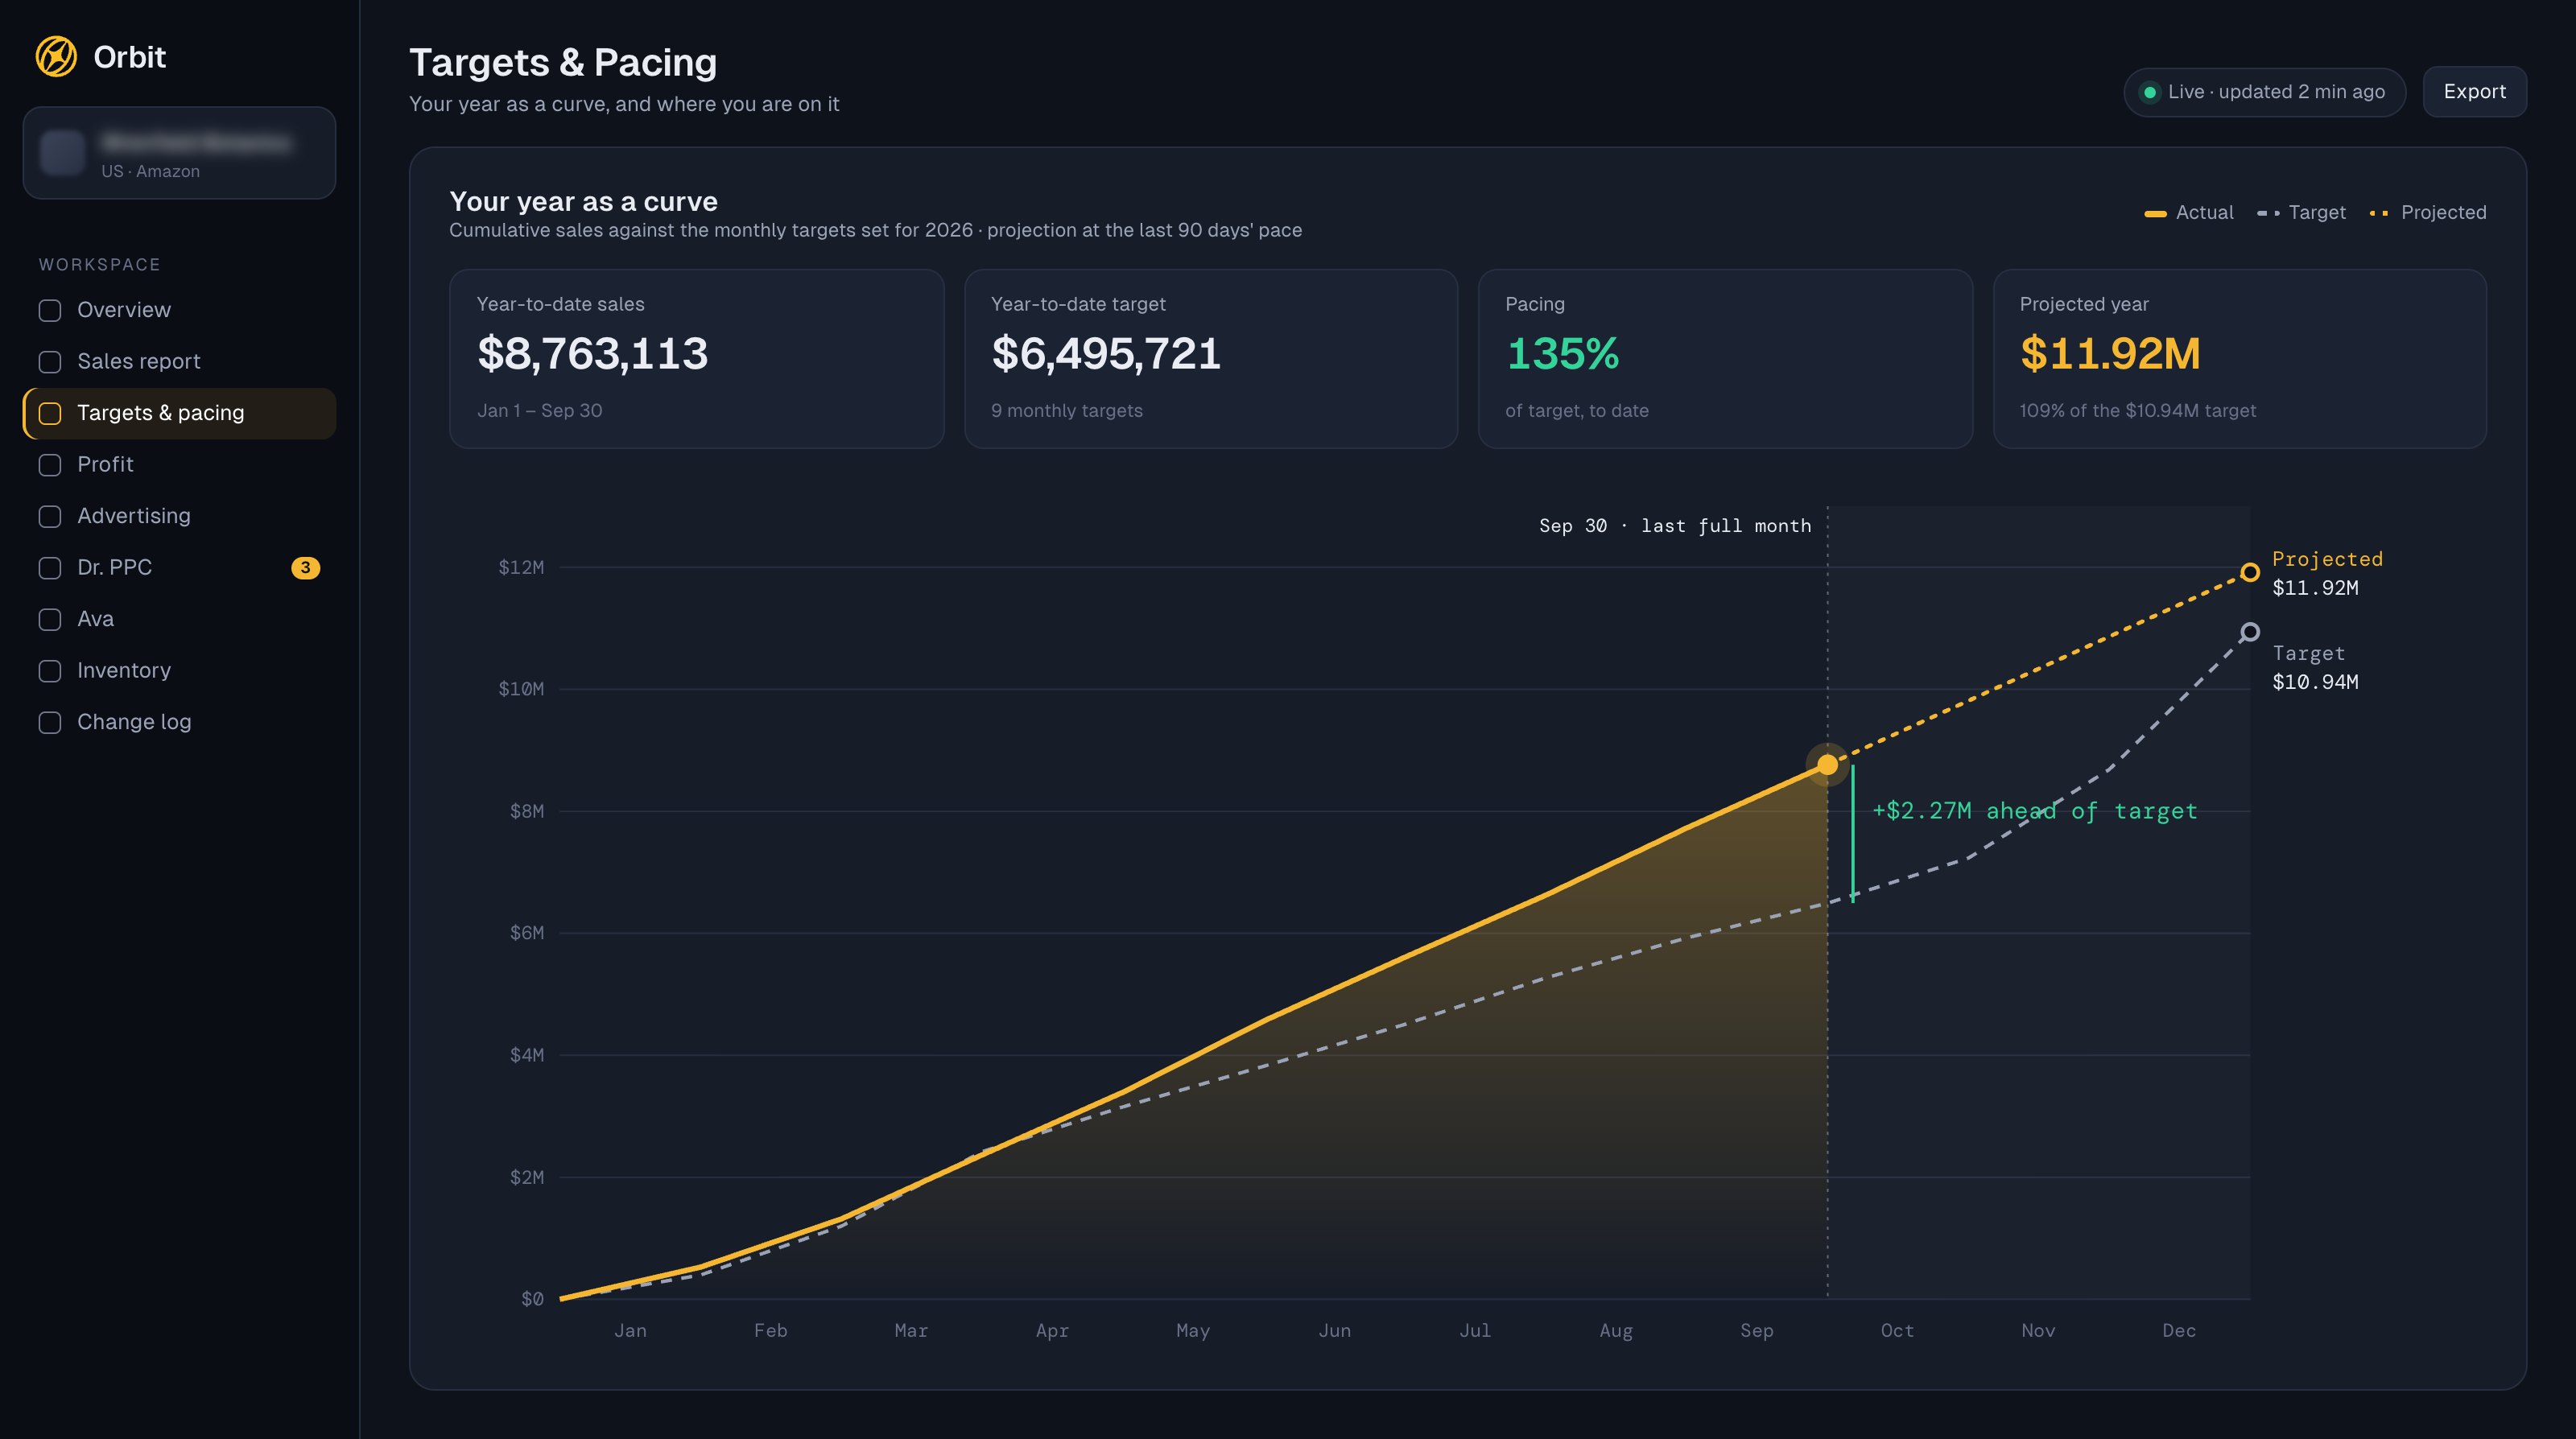
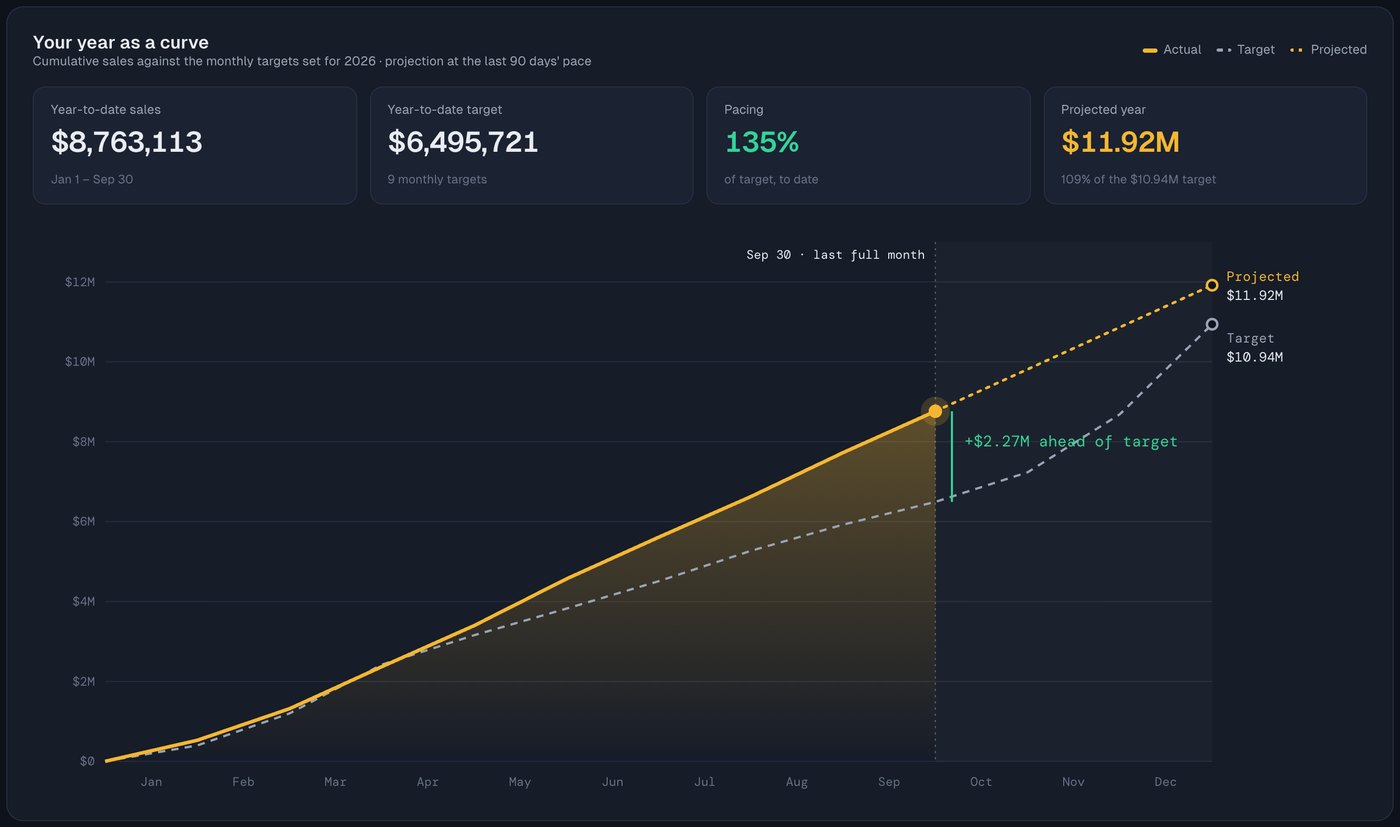
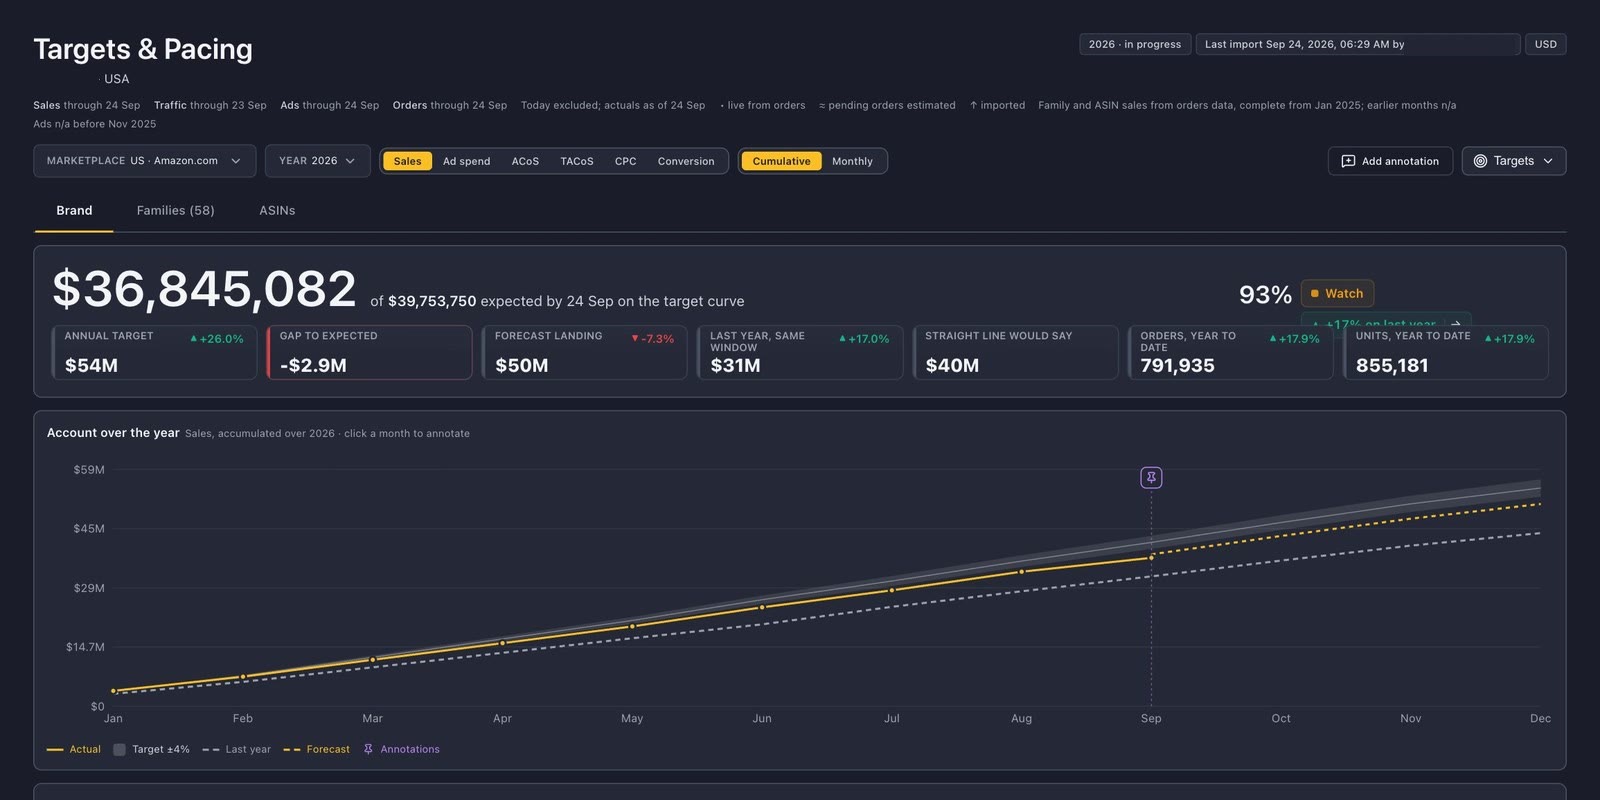
Targets and pacing
Where you'll land against your goal, month by month, while there's still time to change it. Ava watches it every morning.
03
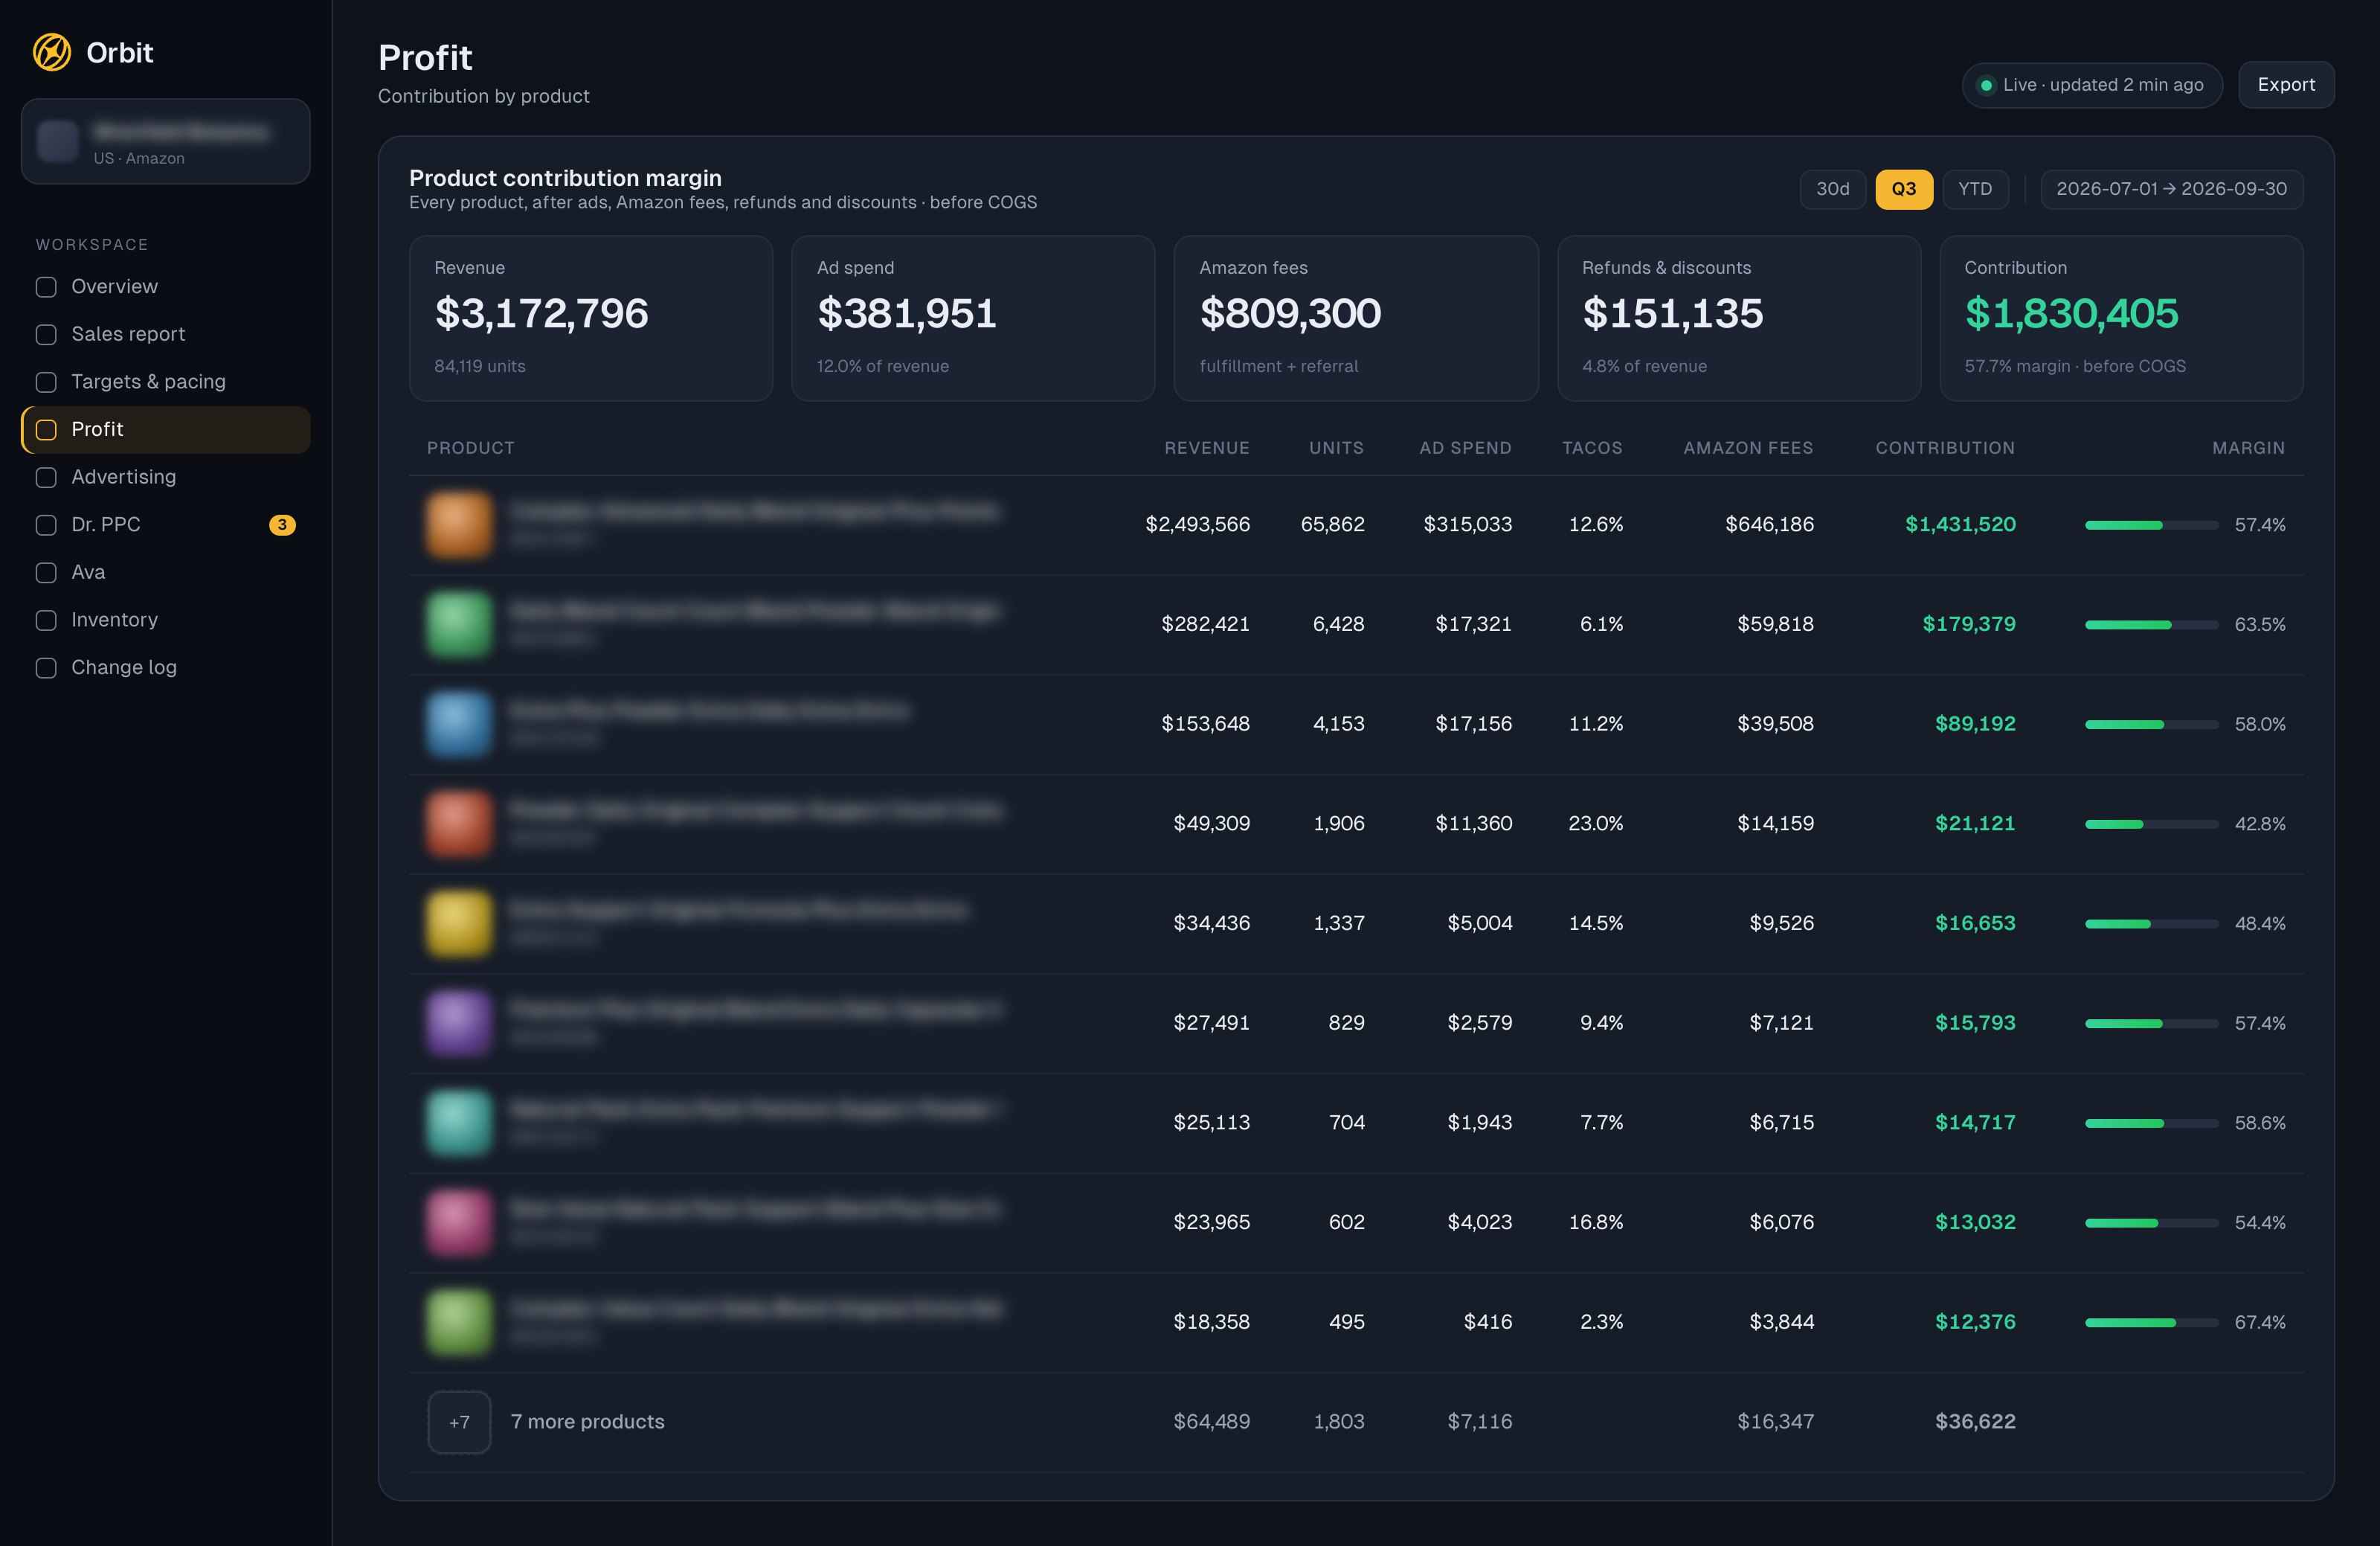
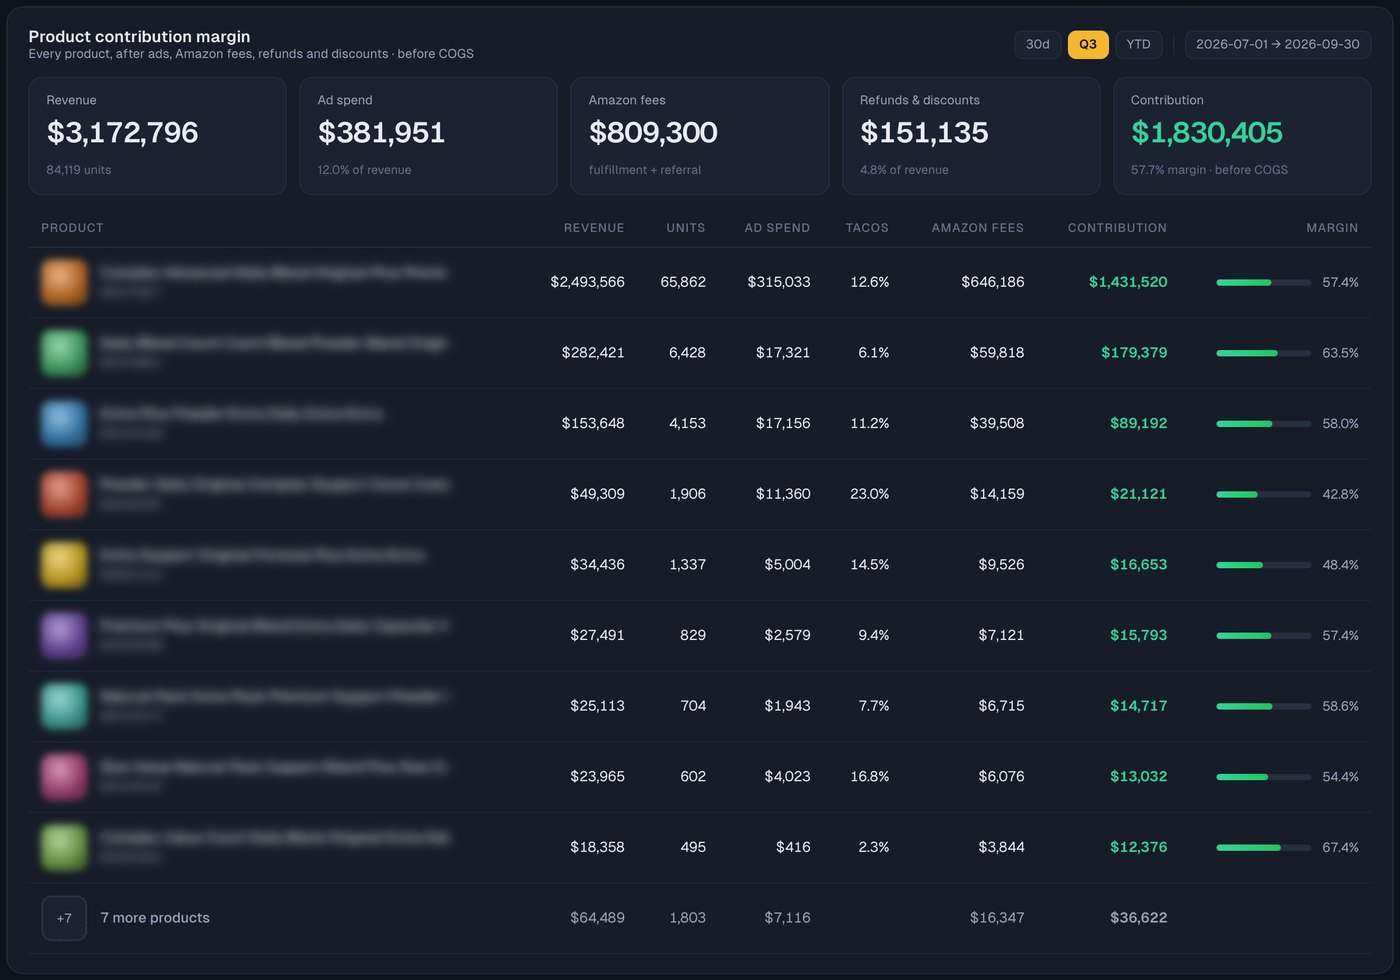
Profit by product
Contribution margin for every product after ad spend, Amazon fees, refunds and discounts, so the budget follows what actually earns.
04
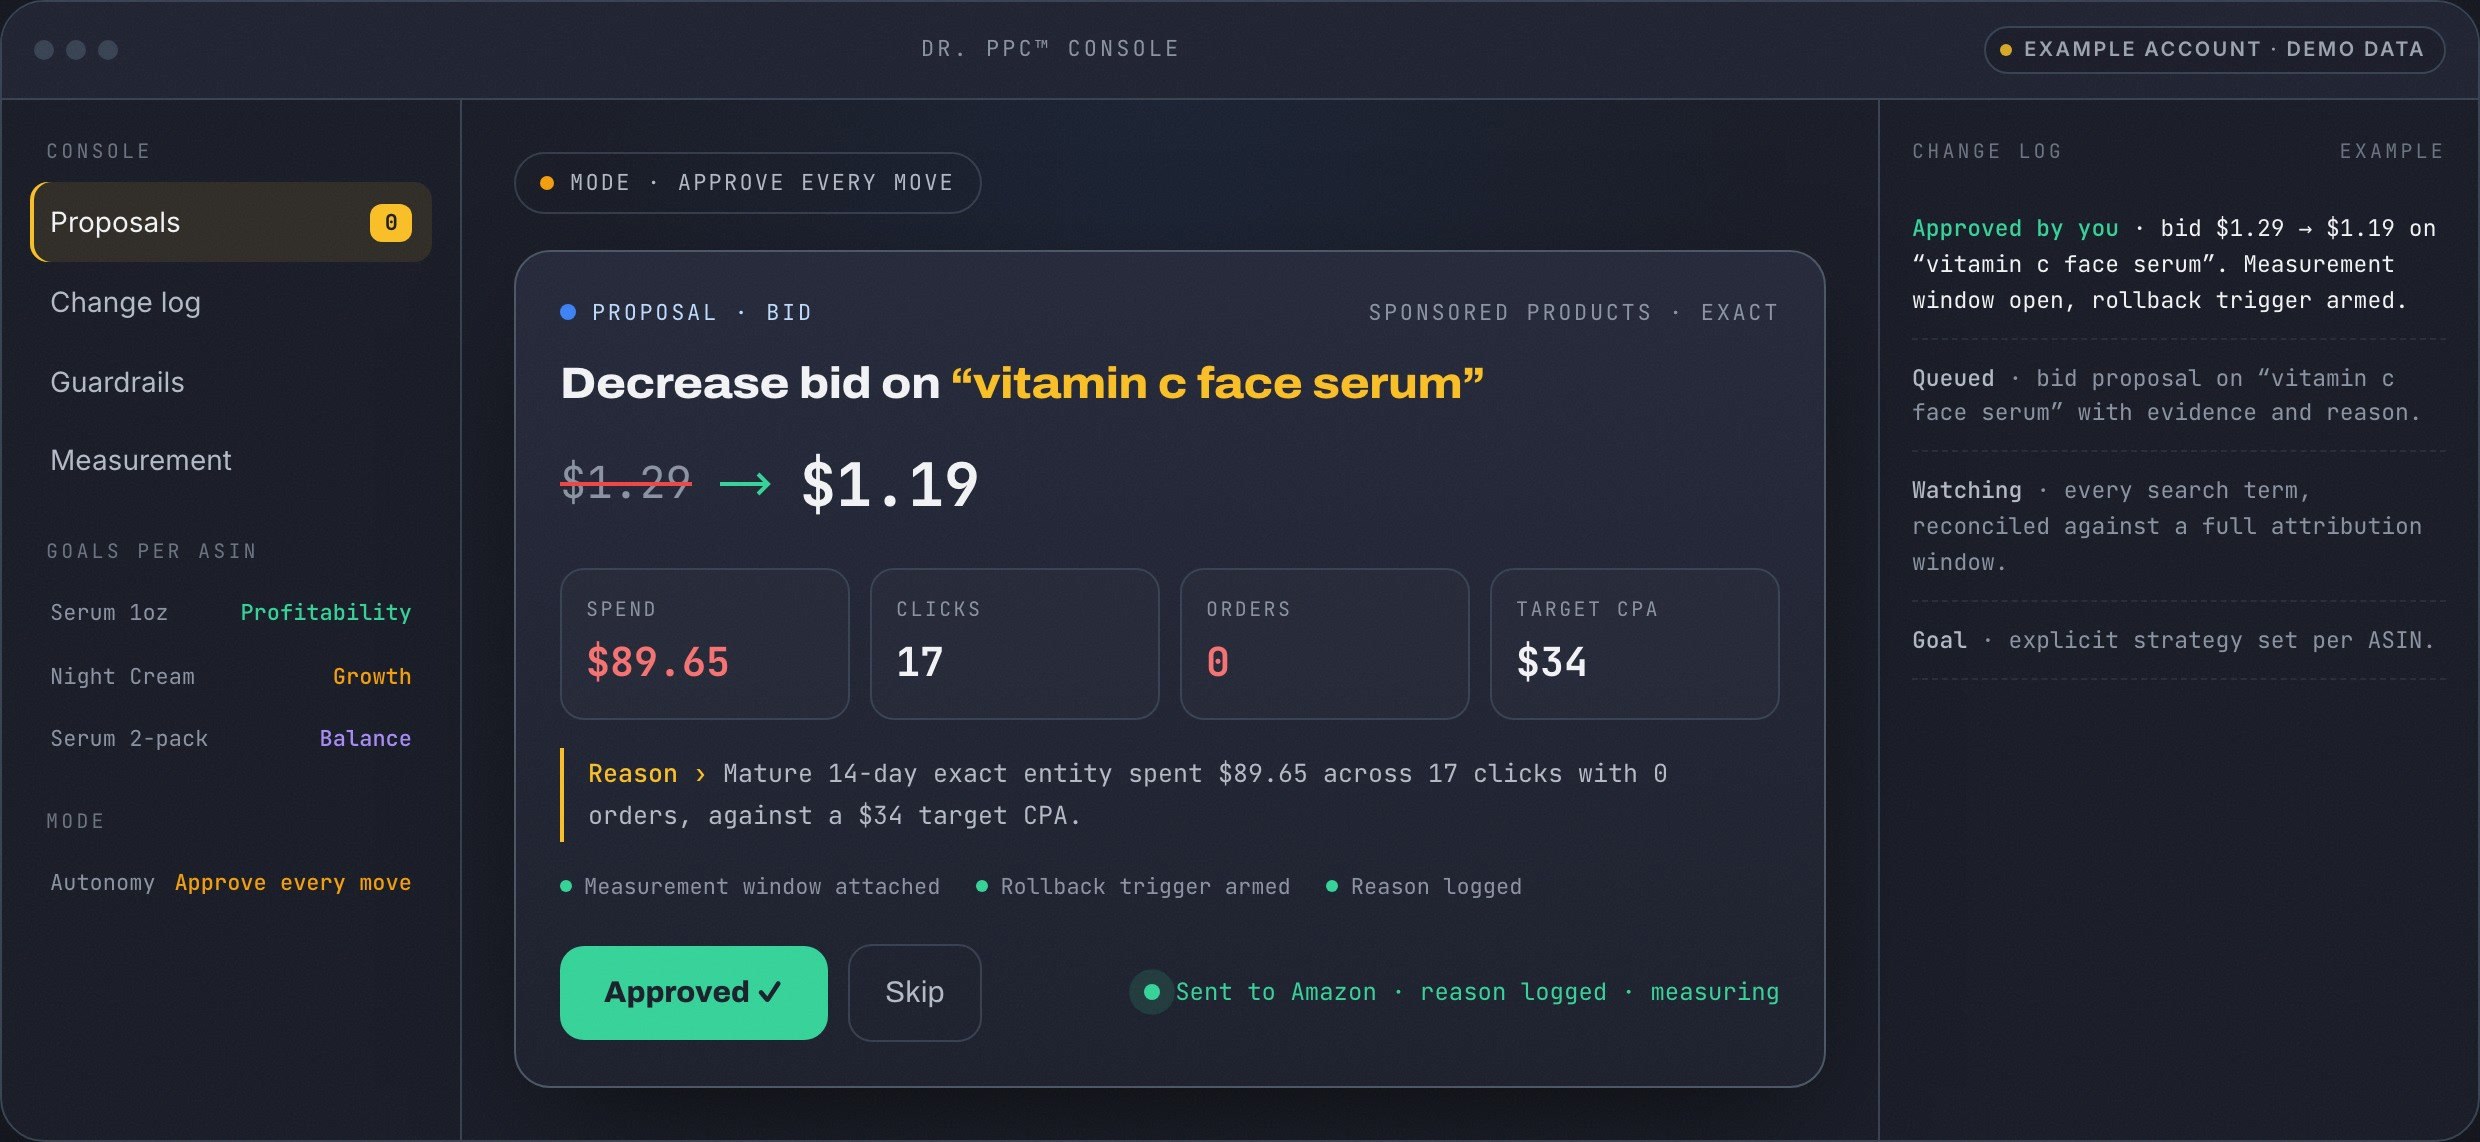
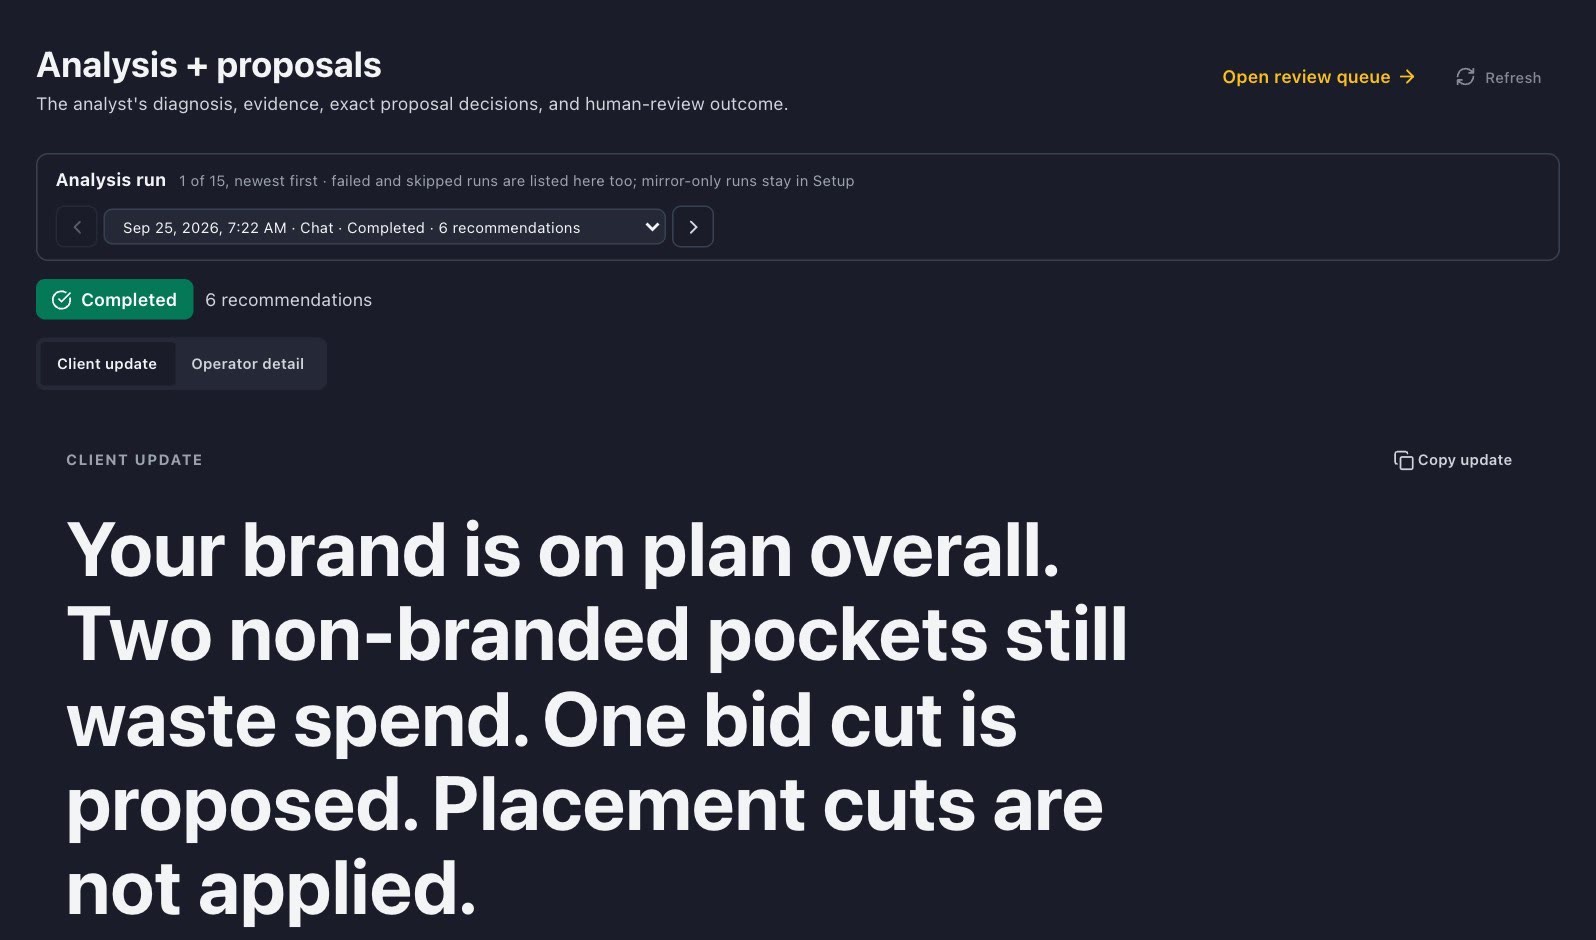
Dr. PPC reads your ads
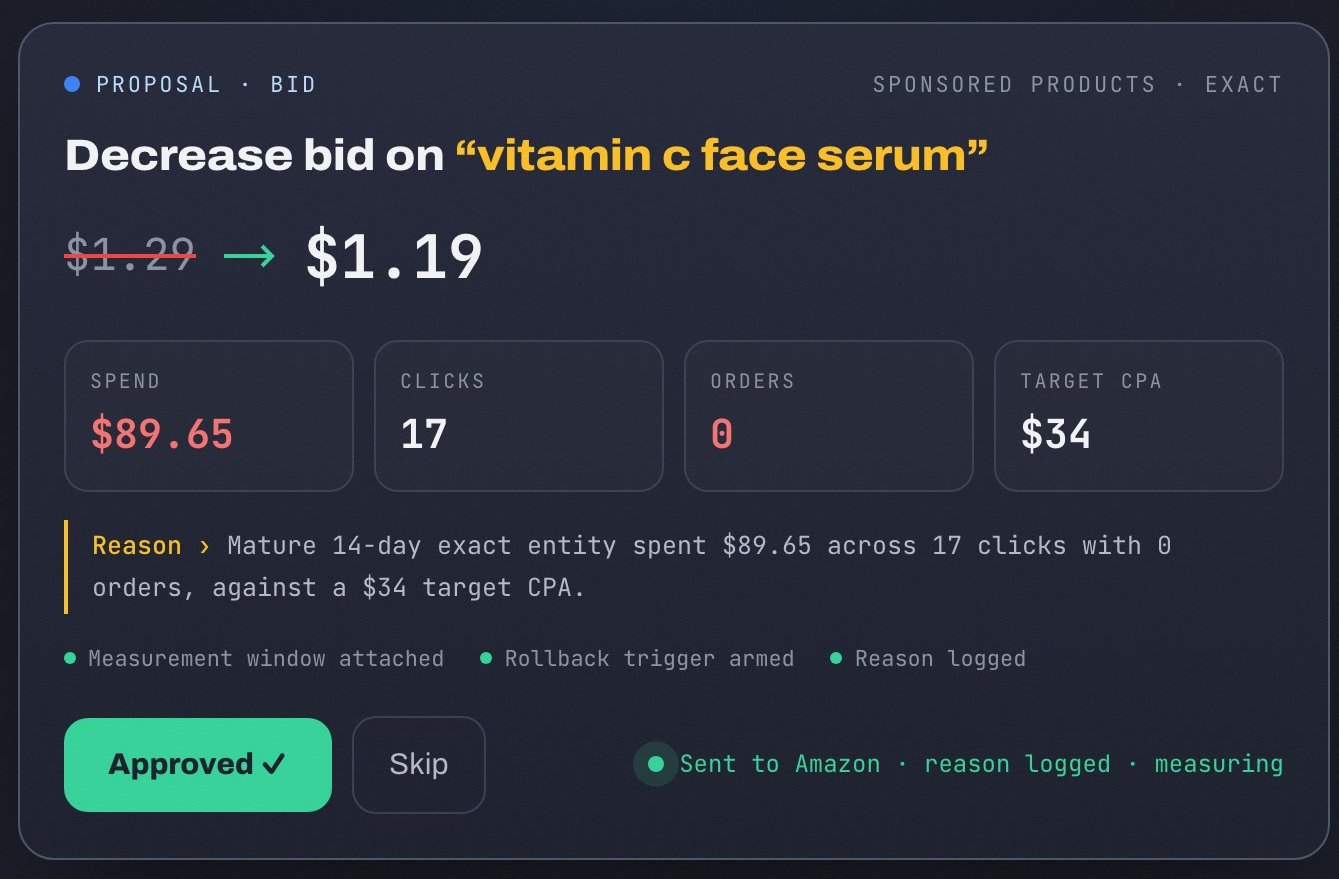
Every proposal comes with its evidence and a plain-English reason. Your expert approves it before anything reaches Amazon.
05
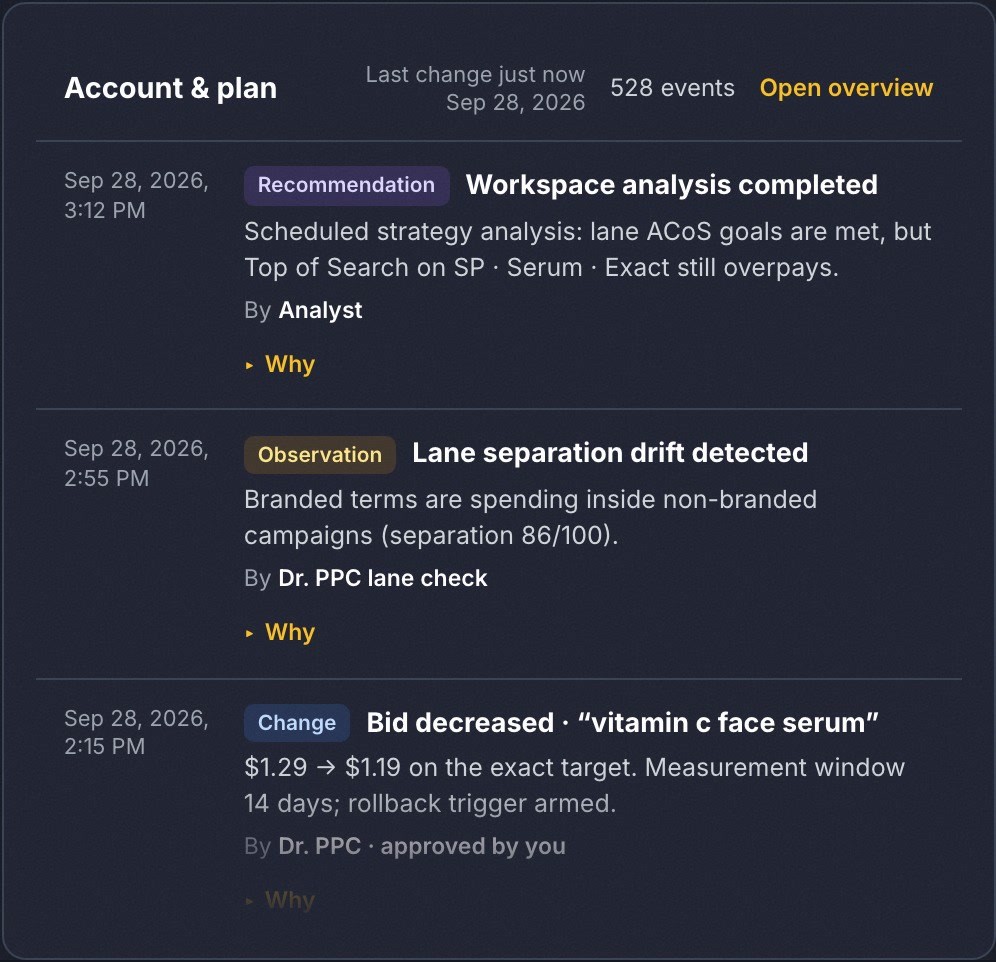
Every move, logged
Every recommendation, observation and change, by Dr. PPC or your expert, with the reason why. You can always see what happened and who decided it.
fullcircleorbit.com · Live sales
Orbit views with one real account's numbers, brand hidden · Dr. PPC screens show example data
The evolution of an Amazon channel
The old way. The new way.
Every growing brand hits the same wall. The ones that scale predictably stop managing Amazon in pieces, and stop guessing.
01The old way
Silos
Six vendors. Six dashboards.
An ads agency, a listing freelancer, an inventory planner, a case consultant. Each one optimizes its own number. Nobody owns yours.
Silos
Finger-pointing
No single owner
Ads agencyReportingInventory plannerCase consultantPromotions3PLWho owns the number?
02The old way
Bait and switch
Senior pitch. Junior delivery.
The partner wins the deal, then hands you to a coordinator by month two. The person who sold you never touches your account again.
Junior handoff
Learning on your budget
Week 1 · Calendar invite
Strategy call with our Senior Partner"I'll personally oversee your account."
Month 2 · Email
Intro: meet your new account coordinator"She'll be your main point of contact going forward."
Month 3 · Email
Re: your monthly report"Sorry for the delay, sending it over Friday."
03The old way
Guesswork
Monthly meetings. Daily problems.
Amazon changes by the hour. Reports arrive by the month, full of charts explaining what already happened. Growth becomes a guess.
Dashboard theater
Set and forget
Monthly_Report_FINAL_v3.pdf27 days until the next review
04The new way
One team
One team. One plan.
Ads, listings, inventory and account health, run together by one accountable team. We find the one constraint holding you back, and fix that first.
One owner
One plan
One profit view
Ads
Listings
Inventory
Account health
Reimbursements
Creative
One team · one plan · one number
05The new way
True experts
True Amazon experts at the wheel.
Your account is steered by operators who have built and run 7-figure brands. They set the goals, the strategy and the budget, and own the big moments: Prime Day, Black Friday, launches.
7-figure operators
Named expert
Seniority on your account
Your expert 7-figure operatorStill yours
Day 1Prime DayBlack FridayDay 365
Same expert, all year
06The new way
AI-first
AI built on $500M+. Every hour.
Ava and Dr. PPC work your account every day, armed with the playbooks from $500M+ in Amazon revenue managed. Your expert approves the moves, and every reason is logged.
24/7
Logged reasons
Your guardrails
1
2
3
4
5
6
7
8
9
10
11
12
13
14
15
16
17
18
19
20
21
22
23
24
25
26
27
28
29
30
Checked every hour · fixed the same day
07The new way
Predictable
You see it coming.
Live sales, profit and pacing to your goal in Orbit, every day. When you can see where the month will land, scaling stops being a guess.
Live dashboard
Goal pacing
Sales vs goal · this month, live
GoalToday · liveOn pace
Day 1Day 10Day 20Day 30
See where the month lands, every day
Illustrations, not client data
Inside Orbit · your AI teammates
Meet Ava. Meet Dr. PPC.
Two AI agents built on everything we learned managing $500M+ in Amazon revenue. They work your account every day, and your expert decides how much they do on their own.
Ava
Your strategic brand manager
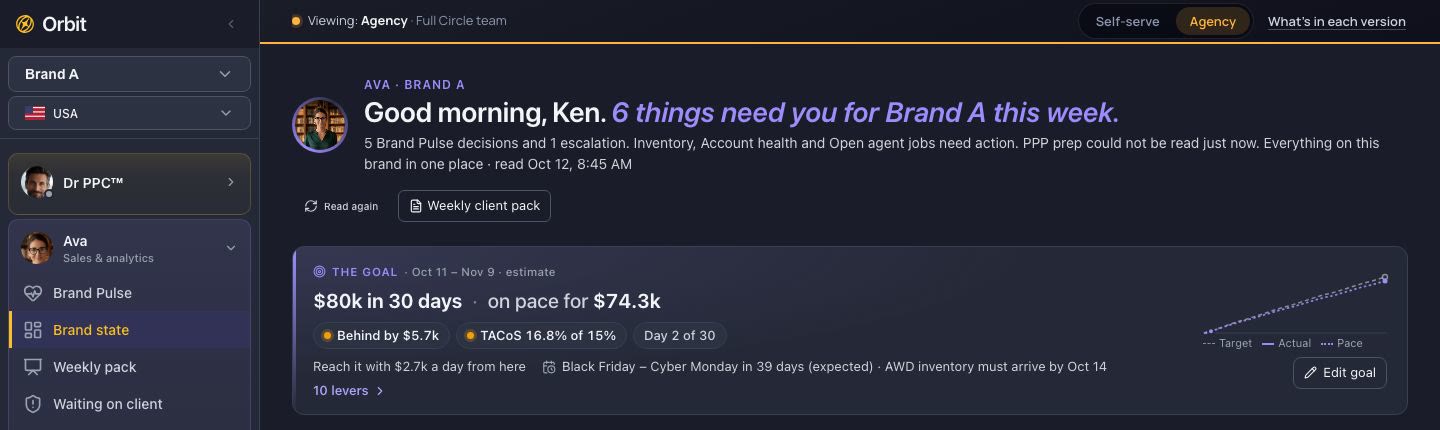
Ava watches your goal every day: where the month will land at today's pace, what's behind, and the few decisions that move it. She writes the morning brief and drafts the weekly client report, so nothing waits for a monthly meeting.
Morning! You're on pace for $74.3k against the $80k goal. Two decisions close the gap: extend the 3-pack coupon and lift the hero campaign budget. Want me to queue both for your expert?
Example message
Goal pacing
Morning brief
Weekly report
Escalations
fullcircleorbit.com · Ava · Today
Dr. PPC
Your autonomous ads specialist
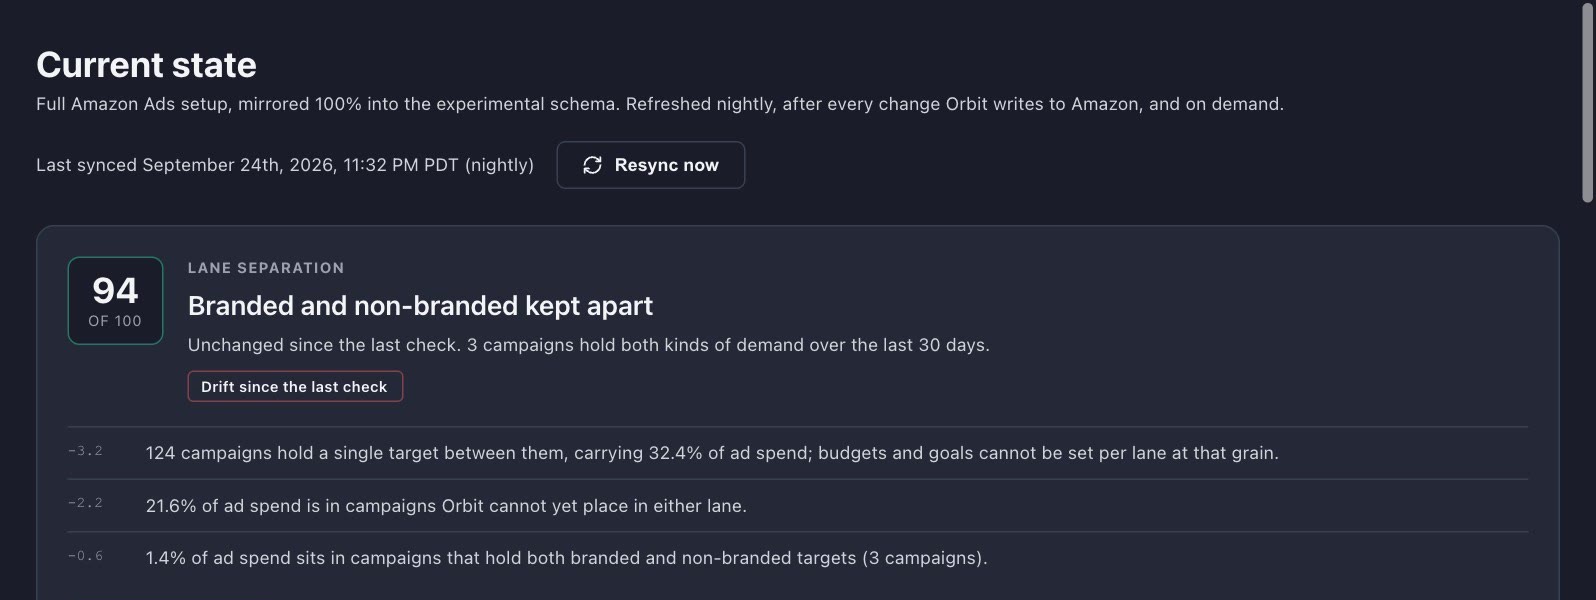
Dr. PPC works every campaign, keyword and search term, every day. Every proposal comes with the evidence, and every bid it moves ships with a logged reason, a measurement window and a rollback trigger.
"organic lion's mane" is converting at twice the account average. I've drafted an exact-match campaign for it with a $40 daily cap. Approve?
Example message
Bids
Budgets
Negatives
Placements
Lane health
fullcircleorbit.com · Dr. PPC · Analysis
Ava and Dr. PPC are software inside Orbit, not people. Your expert chooses how much they do on their own: approve every move, act inside guardrails, or run fully autonomous. Real Orbit screens, client data anonymized.
What we run
Every lever. One team.
Keep scrollingSwipe
01
Advertising
Sponsored Products, Brands, Display and video. Strategy from your expert, daily optimization from Dr. PPC.
Expert + Dr. PPC
02
Goals & pacing
A target for every month and a daily read on where you'll land, so the plan changes before the month is lost.
Expert + Ava
BrunoCreative director
MildMediumSpicy
03
Listings & creative
Every listing starts as three complete directions: Mild, Medium and Spicy. You pick with your eyes. Image stacks, A+ content, video and copy, built to convert.
Creative team + Bruno
organic mushroom coffee
04
Catalog & search
Variations, flat files, indexing and search-term coverage, so the right shoppers can actually find you.
Catalog team
Days of cover
05
Inventory & supply chain
Forecasts, reorders, FBA placement and freight planning, paced to your ads and your cash.
Supply chain team
Account health · OK
06
Account health & cases
Policy, compliance and case management. We pick up the fight so your team doesn't have to.
Case team
$862,005recovered · 35 brands
07
Reimbursements
We find and file the FBA reimbursements Amazon owes you. $862,005 recovered for 35 brands, Feb–Sep 2026.
Case team
08
Brand protection
Hijackers, copycat listings and IP infringement, found and pushed out, then watched for around the clock.
Brand protection team
09
Profit & DTC alignment
Contribution margin by product, plus pricing, promotions and launches planned across Amazon and your own store.
Expert + Ava
Now playing · your brand
10
Audiences & streaming TV
Amazon's audience network, on and off Amazon and on streaming TV, run with our sister company reMKTR.
reMKTR
11
Global talent
Want your own in-house specialists too? We recruit world-class Amazon talent in 21 days.
Predictable scale starts with finding the one thing holding you back. Fixing everything at once fixes nothing. Pick what hurts most and see where we'd start.
fullcircleorbit.com · Diagnostic1 constraint found
Diagnosis
Spend is chasing the wrong demand.
Who owns itYour expert+Dr. PPC
First moves
Find the search terms that actually sell, and fund them.
Set a goal per product: profit, growth or a balance.
Move bids daily, with every reason logged.
Across our portfolio, under 1% of search terms drove 80% of ad sales (May–Aug 2026). We find the winners and fund them.
Diagnosis
Inventory is capping the ads.
Who owns itYour expert+Supply chain team
First moves
Forecast demand by SKU, including the big moments.
Draft reorders before cover runs low.
Pace ads to stock so rank survives the gap.
Diagnosis
The listing is the leak.
Who owns itYour expert+Creative team
First moves
Rebuild the main image and the image stack.
Rewrite the copy and A+ story around what shoppers ask.
Test every version before it ships.
Diagnosis
Risk is eating your attention.
Who owns itYour expert+Case team
First moves
Audit the account, the listings and the policy flags.
Draft and file cases with the evidence attached.
Watch for hijackers and listing changes around the clock.
Diagnosis
You've harvested the demand that exists.
Who owns itYour expert+reMKTR
First moves
Reach the shoppers who looked and left.
Find in-category shoppers who never typed your keyword.
Put your brand on streaming TV, aimed by Amazon's shopper signals.
Diagnosis
There's no goal to pace against.
Who owns itYour expert+Ava
First moves
Set a monthly sales and TACoS target for every month of the year.
Read the pace every morning, not at month end.
Pull the levers that close the gap while there's still time.
Illustrative. Your diagnostic call looks at your real account.
What we did, how we did it, and what it was worth. Anonymized, because our clients' numbers are theirs. The playbook isn't.
Case file 01 · Pet calming · 8-figure brand
$406K to $2.75M a month in 8 months
$406K/mo →$2.75M/momonthly US Amazon sales · Jul 2025 → Mar 2026
6.8×monthly US Amazon sales ($406K → $2.75M)Jul 2025 → Mar 2026
$19.3MUS Amazon sales in 12 monthsSep 2025–Aug 2026
47% → 24%ACoS while ad sales grew from $347K to $1.46M a monthNov 2025 → Feb 2026
31,649new-to-brand ad ordersDec 2025–Aug 2026
10 of 10months above $1.3M in salesDec 2025–Sep 2026
Monthly US Amazon sales · numbered dots mark each phase below
The starting point
The brand had just restarted on Amazon in June 2025, at about $94K that month. It needed to scale fast without ad costs scaling faster.
The approach
One constraint first: the cost of each new sale. Our experts kept widening the set of search terms that actually sell and kept launching new campaigns, so efficiency improved as spend grew instead of breaking.
What we did, step by step
Jun–Oct 2025Relaunch and first promotions
Sales restarted in mid-June 2025 and climbed from $94K that month to $894K in October. Amazon coupon fees are on file for August and September, and a Lightning Deal fee for October.
$94K → $894K Monthly sales, Jun → Oct 2025
Nov–Dec 2025Scaled the campaign structure for Q4
171 campaigns were live by November, including 2 Sponsored TV campaigns launched on Nov 26. December added 99 more (86 Sponsored Brands, 11 Sponsored Products, 2 Sponsored Display), and ACoS eased from 47.3% to 42.2% as ad spend grew from $164K to $271K.
99 New campaigns, Dec 2025
Jan–Mar 2026Grew ad sales while cost per sale fell
Ad sales rose from $643K in December to $1.46M in February while ACoS dropped to 23.8%; the campaigns launched in December alone brought in $427K of February's ad sales. Converting search terms reached 4,527 in March (from 3,355 in January), and 18 more campaigns went live, including 2 more Sponsored TV.
47% → 24% ACoS, Nov 2025 → Feb 2026
Apr–Sep 2026Held the new level above plan
The team kept launching campaigns (87 new from April to September) while ads stayed at 15–19% of total sales. Every month landed between $1.38M and $2.01M, above the $1M monthly goal on file for 2026.
$1.38M–$2.01M Monthly sales range, Apr–Sep 2026
The result
Monthly sales went from $406K to $2.75M in eight months. Over the 12 months to August 2026 the brand did $19.3M in US Amazon sales.
Monthly sales, Jul 2025
$406K
→
Monthly sales, Mar 2026
$2.75M
Anonymized: category and size only, imagery is illustrative and not the brand's. Individual result, not typical. Past performance doesn't guarantee future results.
Under 10%ad spend as a share of total sales, every monthNov 2025–Sep 2026
$1.19Msales in four Prime Day daysJun 23–26, 2026
6.8×return on ad spendJun–Aug 2026
3.6×June sales vs the June before ($463K → $1.66M)Jun 2025 → Jun 2026
Monthly US Amazon sales · numbered dots mark each phase below
The starting point
A fast-rising footwear brand wanted to keep growing without letting ad costs climb as fast as sales.
The approach
The constraint was efficiency at scale: growth only counts if ad costs don't eat it. Our experts held ads to a tight share of sales all year and saved the big push for Prime Day, when demand peaks.
What we did, step by step
Oct–Nov 2025First $1M months
Lightning Deals ran in October (fees billed Oct 19–23), and the brand posted its first $1M months: $1.48M in October and $1.28M in November.
$1.48M October 2025 sales
Nov–Dec 2025Efficient core plus a Brands and Display layer
62 Sponsored Products campaigns were live by November. In December, 11 Sponsored Brands and 3 Sponsored Display campaigns were added, while total ad spend stayed at 7.8% of sales.
14 New Brands + Display campaigns, Dec 2025
Jan–May 2026Kept ads lean and reworked listings
Ad spend stayed between 7.4% and 9.9% of sales every month. The team built 5 listing-optimization projects in March–April (competitor analysis, rewritten copy, creative briefs), and conversion rate moved from 2.3% in January to 3.1% in April.
5 Listing-optimization projects, Mar–Apr 2026
Jun 2026Scaled spend into Prime Day
June ad spend rose to $129K, 2.1× May's $61K, and returned $859K in ad sales at 15.0% ACoS; 28 new Sponsored Products campaigns went live from June 23. Prime Day (Jun 23–26) brought $1.19M in four days, and June's $1.66M was the brand's best month on record.
$1.19M Prime Day sales, Jun 23–26, 2026
The result
12-month US sales doubled from $4.84M to $9.90M, a gain of $5.1M. Prime Day 2026 brought in $1.19M in four days, and June ($1.66M) was the brand's best month on record.
12-month US sales, Sep 2024–Aug 2025
$4.84M
→
12-month US sales, Sep 2025–Aug 2026
$9.90M
Anonymized: category and size only, imagery is illustrative and not the brand's. Individual result, not typical. Past performance doesn't guarantee future results.
$689Kpeak monthly US Amazon sales, from a $2.2K launch monthJul 2025 → Apr 2026
4.0%ad spend as a share of total salesMar and Apr 2026
6.5% → 13.4%conversion rate (units per session)Nov 2025 → Mar 2026
2.4×converting search terms (161 → 383)Jan → Mar 2026
599new-to-brand ad ordersApr 2026
$3.67MUS Amazon sales in 12 monthsSep 2025–Aug 2026
Monthly US Amazon sales · numbered dots mark each phase below
The starting point
A premium at-home therapy device made its first Amazon sale in late July 2025. It needed to scale without a heavy ad bill eating the margin.
The approach
The constraint was cost per sale on a premium device. Our experts built the campaign structure in the first months and widened the search terms that convert, so ads stayed at about 4% of total sales as monthly revenue passed $500K.
What we did, step by step
Jul–Oct 2025Launch and first traction
The device made its first US sale on Jul 27, 2025 and grew from $2.2K that month to $164K in October; a Lightning Deal fee is on file for October.
$2.2K → $164K Monthly sales, Jul → Oct 2025
Nov–Dec 2025Built the campaign structure
16 Sponsored Products campaigns were live by November. December added 17 new campaigns (10 Sponsored Products, 6 Sponsored Brands, 1 Sponsored Display).
17 New campaigns, Dec 2025
Jan–Feb 2026Moved spend onto the new structure
19 more campaigns went live in January–February. From January, every dollar of ad sales came from campaigns launched since December, and ACoS improved from 10.2% in January to 7.8% in February.
10.2% → 7.8% ACoS, Jan → Feb 2026
Mar–Apr 2026Scaled to the peak at 4% of sales
Converting search terms grew from 161 in January to 383 in March, and conversion rate reached 13.4%. Sales hit $581K in March and $689K in April with ads at 4.0% of sales and ACoS of 6.5–8.2%; April brought 599 new-to-brand ad orders.
4.0% Ad spend as a share of sales, Mar–Apr 2026
The result
Monthly sales went from a $2.2K launch month to a $689K peak in April 2026. The brand did $3.67M in US Amazon sales in the 12 months to August 2026.
Launch month, Jul 2025
$2.2K
→
Peak month, Apr 2026
$689K
Anonymized: category and size only, imagery is illustrative and not the brand's. Individual result, not typical. Past performance doesn't guarantee future results.
Case file 04 · Topical pain relief · 7-figure brand
$13K to $604K a month in 4 months
$13K/mo →$604K/momonthly US Amazon sales · Dec 2025 → Mar 2026
$13K → $604Kmonthly US Amazon salesDec 2025 → Mar 2026
$3.48MUS Amazon salesDec 2025–Sep 2026
2.0×sales vs plan ($3.47M vs $1.73M; 8 of 9 months over goal)Jan–Sep 2026
Under 2%ad spend as a share of sales during the launchJan–May 2026
16–23%ACoS while monthly ad spend grew 5.6×Jun–Sep 2026
Monthly US Amazon sales · numbered dots mark each phase below
The starting point
This line had essentially no Amazon sales for the 15 months before November 2025. The launch plan had to keep up with demand from the first month.
The approach
The constraint was keeping pace with demand, not buying it. Our experts set the plan early and raised it every month, kept ad spend minimal while organic sales climbed, and only scaled ads once the curve flattened.
What we did, step by step
Nov 2025Campaigns set up before the first order
The first 2 Sponsored Products campaigns were set up on Nov 10, 2025, 18 days before the first order on Nov 28. 8 more followed in December–January, with paid spend starting in January.
18 Days from first campaigns to first order
Dec 2025–Feb 2026A lean launch against a rising plan
A monthly sales plan, set in December 2025 and January 2026, steps up every month, from $113K for January to $268K for September 2026. Sales went from $13K in December to $185K in February on $957 of ad spend across January–February.
$13K → $185K Monthly sales, Dec 2025 → Feb 2026
Mar–May 2026Kept pace with a demand surge
Sessions rose 2.6× in March and conversion reached 24%, taking sales to $604K. Ad spend stayed under 2% of sales from January through May.
$604K March 2026 sales
Jun–Sep 2026Scaled ads once growth leveled off
43 new campaigns went live (16 in June, 24 in August, 3 in September) and monthly ad spend grew 5.6×, from $7.7K in May to $43K in September, at 16–23% ACoS. The August campaigns produced $149K of September's $189K in ad sales.
43 New campaigns, Jun–Sep 2026
The result
Monthly sales grew from $13K to $604K in four months. January–September 2026 sales reached $3.47M against a $1.73M plan, 2.0× the goal.
Monthly sales, Dec 2025
$13K
→
Monthly sales, Mar 2026
$604K
Anonymized: category and size only, imagery is illustrative and not the brand's. Individual result, not typical. Past performance doesn't guarantee future results.
$530Kbest month on record, 4.9× the same month in 2024Sep 2026
11–13%ad spend as a share of total sales, every monthJan–Jul 2026
1,500–2,100new-to-brand ad orders a monthJan–Jul 2026
7 of 7months over a sales goal set in advanceMar–Sep 2026
Monthly US Amazon sales · numbered dots mark each phase below
The starting point
A multi-product wellness brand wanted every product line to grow, not just one hero, while keeping ads near a tenth of sales.
The approach
The constraint was reach: growth had to come from more shoppers finding more of the catalog. Our experts kept widening the search terms that convert and launching new campaigns every month, with ads held near 12% of sales.
What we did, step by step
Sep 2024–Oct 2025A steady climb with a promotion calendar
Monthly sales grew from $108K in September 2024 to $408K in October 2025, with Amazon coupon fees on file in most months and Lightning Deal fees in October and December 2024 and in April, July and October 2025.
$108K → $408K Monthly sales, Sep 2024 → Oct 2025
Nov–Dec 2025Expanded the ad structure
110 Sponsored Products campaigns were live by November. December added 99 new campaigns (45 Sponsored Display, 33 Sponsored Brands, 21 Sponsored Products), and new-to-brand ad orders reached 1,979 that month.
99 New campaigns, Dec 2025
Jan–Mar 2026Widened the search terms that sell
89 more campaigns went live, and converting search terms grew from 1,558 in January to 1,956 in March. By March, about half of all ad sales came from campaigns launched since December, with total ad spend at 11–12% of sales.
1,558 → 1,956 Converting search terms, Jan → Mar 2026
Apr–Jul 2026Kept launching, kept efficiency
157 new campaigns went live (39, 49, 47 and 22 a month), and campaigns launched since December produced 58–69% of ad sales. Ads held at 11–13% of sales, with 1,694–2,059 new-to-brand ad orders a month and Amazon deal fees on file every month.
58–69% Share of ad sales from campaigns launched since Dec 2025
The result
12-month US sales grew from $2.49M to $5.31M (+114%). September 2026 was the brand's best month on record at $530K, 4.9× September 2024.
12-month US sales, Sep 2024–Aug 2025
$2.49M
→
12-month US sales, Sep 2025–Aug 2026
$5.31M
Anonymized: category and size only, imagery is illustrative and not the brand's. Individual result, not typical. Past performance doesn't guarantee future results.
26×December sales vs the December before ($50K → $1.33M)Dec 2024 → Dec 2025
27.9% → 20.4%ACoS as ad spend grew into the peakNov → Dec 2025
3,072new-to-brand ad ordersDec 2025
~10%ad spend as a share of sales (10.3%, 9.7%)Nov–Dec 2025
Monthly US Amazon sales · numbered dots mark each phase below
The starting point
A giftable accessories brand had a small holiday business: $378K in Q4 2024 and about $50K that December.
The approach
The constraint was holiday capacity: this brand's year is won or lost in about eight weeks. Our experts added a December campaign wave on top of the November structure, set an aggressive December goal, and let spend follow demand while ads stayed near 10% of sales.
What we did, step by step
Oct 2025Opened the holiday quarter early
October sales reached $409K, 2.1× October 2024, and a Lightning Deal ran that month (fee billed Oct 19).
$197K → $409K October sales, 2024 → 2025
Nov 2025Scaled spend on a 149-campaign base
149 Sponsored Products campaigns were live by November. Ad spend reached $104K at 27.9% ACoS and 10.3% of sales, and the brand had its first $1M month ($1.01M).
$1.01M November 2025 sales
Dec 2025A December campaign wave against a $400K goal
35 new campaigns (23 Sponsored Brands, 12 Sponsored Display) brought in $125K of December's $634K ad sales. ACoS improved to 20.4% at $129K spend (9.7% of sales), with 3,072 new-to-brand ad orders and a holiday Lightning Deal (fee billed Dec 12). December sales reached $1.33M, 3.3× the goal.
$1.33M vs $400K December sales vs goal
The result
Q4 sales grew 7.3×, from $378K to $2.74M. November ($1.01M) and December ($1.33M) were the brand's first $1M months, and December beat its goal 3.3×.
Q4 2024 sales
$378K
→
Q4 2025 sales
$2.74M
Anonymized: category and size only, imagery is illustrative and not the brand's. Individual result, not typical. Past performance doesn't guarantee future results.
17 of 17months up on the same month a year earlierMay 2025–Sep 2026
$1.04Mbest month on recordJul 2026
3.6×monthly new-to-brand ad orders (378 → 1,368)Mar → Aug 2026
+17%units sold (394K → 459K)Jan–Sep 2025 → Jan–Sep 2026
Monthly US Amazon sales · numbered dots mark each phase below
The starting point
An established skincare brand was steady at $500K–$800K a month. To keep compounding, it needed to reach new customers.
The approach
The constraint was new-customer reach for a mature product line. Our experts built out the campaign program through 2026 and leaned into new-to-brand acquisition while sales kept beating the prior year every month.
What we did, step by step
Jan–Mar 2026Added Brands and Display to a 145-campaign base
145 Sponsored Products campaigns were live by January. February and March added 66 more, including 15 Sponsored Brands and 11 Sponsored Display campaigns, and new-to-brand ad orders rose from 97 to 378.
66 New campaigns, Feb–Mar 2026
Apr–Jun 2026Kept launching and widened reach
196 more campaigns went live, and converting search terms grew from 2,875 in March to 4,055 in June. New-to-brand ad orders reached 958 in June, the month sales first passed $1M ($1.00M, up 35% on June 2025).
Jun 2026 First $1M month
Jul 2026A 223-campaign launch wave
July added 223 new campaigns, 41 of them Sponsored Brands. July sales hit $1.04M, the brand's best month on record and up 30% year over year, with 1,070 new-to-brand ad orders.
223 New campaigns, Jul 2026
Aug–Sep 2026New-customer highs
New-to-brand ad orders reached 1,368 in August and 1,363 in September, the highest since tracking began. Sales stayed above the prior year, up 22% in August and 13% in September.
378 → 1,368 New-to-brand ad orders, Mar → Aug 2026
The result
January–September 2026 sales reached $7.91M, up $1.5M (+24%) on the same months of 2025, including the brand's first two $1M months (June $1.00M, July $1.04M).
Jan–Sep 2025 sales
$6.39M
→
Jan–Sep 2026 sales
$7.91M
Anonymized: category and size only, imagery is illustrative and not the brand's. Individual result, not typical. Past performance doesn't guarantee future results.
Case file 08 · Seasonal home & outdoor · 7-figure brand
Peak month more than doubled to $998K
$479K →$998Kpeak-month (June) US Amazon sales · Jun 2025 → Jun 2026
+108%peak-month sales ($479K → $998K)Jun 2025 → Jun 2026
+84%Mar–Jun season sales ($1.36M → $2.51M)2025 → 2026
Under 9%ad spend as a share of sales at the peak (8.6%, 8.5%)May–Jun 2026
3.7×converting search terms (196 → 729)Feb → Jun 2026
789new-to-brand ad ordersJun 2026
Monthly US Amazon sales · numbered dots mark each phase below
The starting point
A highly seasonal brand earns most of its year in a few spring months. The season has to be built before demand arrives.
The approach
The constraint was timing: in a seasonal business, campaigns built in May are too late. Our experts built the structure in winter, widened the converting search terms as the season ramped, and let spend rise with demand while ads stayed under 9% of sales at the peak.
What we did, step by step
Nov 2025–Jan 2026Built the season in winter
100 Sponsored Products campaigns were live by November. December added 43 (32 Sponsored Brands, 7 Sponsored Display, 4 Sponsored Products) and January 18 more, while monthly ad spend stayed around $13K–$18K.
161 Campaigns live or launched by Jan 2026
Feb–Mar 2026Set the plan and widened search terms
A monthly sales plan for the whole year was on file by Feb 9. Converting search terms grew from 196 in February to 259 in March, and March sales reached $307K, up 66% on March 2025.
$185K → $307K March sales, 2025 → 2026
Apr–Jun 2026Scaled into the peak
63 new campaigns went live (30, 19 and 14) and ad spend rose from $48K to $85K, while ads fell to 8.5–8.6% of sales in May and June. Converting search terms reached 729 and new-to-brand ad orders 789 in June. Sales beat plan by 12%, 24% and 44%.
$479K → $998K June sales, 2025 → 2026
Jul–Sep 2026Sized spend for the off-season
Ad spend came back down to $12K–$16K a month after the peak, and off-season sales still grew 25%: $467K in Jul–Sep 2026 vs $374K a year earlier.
+25% Off-season sales, Jul–Sep 2025 → 2026
The result
June sales more than doubled, from $479K to $998K. The March–June season grew 84%, from $1.36M to $2.51M.
June 2025 sales
$479K
→
June 2026 sales
$998K
Anonymized: category and size only, imagery is illustrative and not the brand's. Individual result, not typical. Past performance doesn't guarantee future results.
Case file 09 · Organic supplements · 7-figure brand
+26%12-month US Amazon sales ($5.52M → $6.94M)Oct 2024–Sep 2025 → Oct 2025–Sep 2026
+15%units soldFeb–Sep 2025 → Feb–Sep 2026
4×monthly new-to-brand ad orders (137 → 544)Mar → Apr 2026
Monthly US Amazon sales · numbered dots mark each phase below
The starting point
A supplement brand doing about $5M a year wanted to break past its plateau and bring in more first-time buyers.
The approach
The constraint was reach: the brand needed more first-time buyers. Our experts layered Sponsored Brands and Display on top of Sponsored Products, and since August the ad plan runs in Dr. PPC, with the account expert approving each revision.
What we did, step by step
Feb 2026A full Sponsored Products program
By mid-February a large Sponsored Products program was running (1,162 campaigns live when our ads data begins on Feb 15). February sales reached $576K, up 85% on February 2025.
$312K → $576K February sales, 2025 → 2026
Mar–Apr 2026Added Brands and Display to reach new buyers
Sponsored Display went live on Mar 17 and Sponsored Brands on Mar 22, building to 1,270 Brands and 46 Display campaigns by the end of April. New-to-brand ad orders went from 137 in March to 544 in April, and April sales were up 43% year over year.
137 → 544 New-to-brand ad orders, Mar → Apr 2026
May–Aug 2026Sustained new-customer reach
New-to-brand ad orders held at 390–479 a month and 611–722 search terms converted each month, with coupons running from June. In August the account's ad plan moved into Dr. PPC, and the account expert approved its first two plan revisions.
390–479 New-to-brand ad orders a month, May–Aug 2026
Sep 2026Record month
September sales reached $784K, the brand's best month on record and almost double September 2025 ($398K), with coupons running during the month (fees on file Sep 2 and Sep 23).
$398K → $784K September sales, 2025 → 2026
The result
February–September 2026 sales reached $4.83M, up $1.3M (+38%) on the same months of 2025. September 2026 ($784K) was the brand's best month on record, almost double the September before.
Feb–Sep 2025 sales
$3.50M
→
Feb–Sep 2026 sales
$4.83M
Anonymized: category and size only, imagery is illustrative and not the brand's. Individual result, not typical. Past performance doesn't guarantee future results.
Case file 10 · Home pest control · New brand (launched 2026)
Launched in May, $383K a month by September
$0 →$383K/momonthly US Amazon sales · May 2026 → Sep 2026
$1.08MUS Amazon sales since the first orderMay 24–Sep 30, 2026
$383Kbest month so farSep 2026
20–21%ACoS while monthly ad spend grew 6×Jun–Aug 2026
~10%ad spend as a share of sales (9.8–11.3%)Jul–Sep 2026
Monthly US Amazon sales · numbered dots mark each phase below
The starting point
A brand-new home pest-control line had no Amazon history and needed to scale fast at a steady cost per sale.
The approach
The constraint was cost per sale from day one. Our experts had the listing work done before launch and added campaigns in small monthly steps. From August, Dr. PPC drafts campaign builds and ad-plan changes that the account expert approves.
What we did, step by step
May 2026Listing ready before launch
The listing project (competitor analysis, copy, image prompts and a creative brief) was created on May 4, 20 days before the first order on May 24. The first 3 Sponsored Products campaigns went live on May 29.
20 Days from listing project to first order
Jun–Jul 2026A lean, staged ad build
8 new campaigns were added across June and July, and ad spend grew from $5.6K to $29.5K with ACoS holding at 19.9–20.6%. Converting search terms grew from 93 to 349, and sales went from $87K in June to $302K in July.
$302K July 2026 sales
Aug 2026Dr. PPC joins the account
The account expert approved Dr. PPC's ad plan, rules that sort search terms into branded, competitor and generic groups, and a 70/30 budget split between non-branded and branded search (10 approved changes). Dr. PPC also built 2 campaigns. 4 new campaigns went live, including the first Sponsored Brands campaign, and ACoS held at 20.2%.
20–21% ACoS, Jun–Aug 2026
Sep 2026Wider reach, best month yet
6 new campaigns went live, 3 of them built through Dr. PPC on Sep 9 after the expert approved them. Converting search terms reached 680, and sales hit $383K with ads at 11.0% of sales.
$383K September 2026 sales
The result
First sale on May 24, 2026. Sales hit $302K in July, $303K in August and a best-yet $383K in September: $1.08M through September 30.
Monthly sales before launch, Apr 2026
$0
→
Monthly sales, Sep 2026
$383K
Anonymized: category and size only, imagery is illustrative and not the brand's. Individual result, not typical. Past performance doesn't guarantee future results.
Creative studio
Creative that stops the scroll.
News segments, morning shows, street interviews, founder stories and product films, made in-house with the latest AI video models and directed by people who know what sells on Amazon. Every one built from a single Amazon listing.
News anchor
Morning show
Street interviews
Founder stories
Podcast
Product films
UGC-style
AI-generated spots made in-house · tap any spot to play it with sound
Listing creative
Listings built to convert.
Not just to look good. A shopper decides in seconds, mostly on a phone. Every listing we build follows four rules, and every brand sees three complete directions before anything ships.
01
Win the search grid
The main image has one job: get the click in a grid of look-alikes. Product big, pure white, nothing else.
The resultWho it's forSizeHow it worksVs othersWho made it
02
One job per image
Images two to seven answer the shopper's questions in the order they ask them, from what it does to who made it.
Reads in a glance
03
Built for the thumb
Most shoppers buy on a phone. Every headline is checked at phone size, so the point lands in one glance.
AmazonFTCFDA
Clinically provenSource on file
Dermatologist-createdCredentials on file
Instant, permanent resultsCan't be proven · reworded
Cruelty-freeCertificate on file
04
Every claim checked
Every headline and claim is checked against Amazon, FTC and FDA rules before anything ships. If we can't back it up, it doesn't go on the image.
Mild · Medium · Spicy
Same product. Three listings.
1 · Main image2 · Benefit3 · Lifestyle4 · Size5 · How it works6 · Comparison7 · Proof
1 · Main image2 · Benefit3 · Lifestyle4 · Size5 · How it works6 · Comparison7 · Proof
1 · Main image2 · Benefit3 · Lifestyle4 · Size5 · How it works6 · Comparison7 · Proof
Concept images from a client walkthrough, shown as delivered for review.
Client interviews
In their words.
"Just want to say everyone from Full Circle has been really great to work with! … the team's constant new ideas have been really refreshing!"
"We have complete trust in Full Circle. We are hands off on our Amazon account and leave it to the experts at Full Circle to grow and manage our Amazon side of the business, which they have done a tremendous job!"
"New sales channel, unlocked! … Our team excels at creating demand off Amazon. That demand then spills into the marketplace and Ken's team excels at helping us capture it."
Built by operators
We've sat in your seat.
Full Circle was built by people who have carried the inventory, signed the purchase orders and lived with the consequences. That experience is what your expert brings, and what the AI is built on.
Ken FreemanFounder
Ken has sold on Amazon for more than ten years. He built one of Amazon's best-selling back braces, became one of the earliest founders to sell a company to Thrasio, and served as VP of Amazon at Ridge Wallet.
He built Full Circle to give established brands an experienced Amazon department without having to assemble, train and manage one themselves, and recruited operators who had built or exited 7-figure companies of their own to run it.
10+years selling on Amazon
Multi-7figure exit to Thrasio
VPof Amazon, Ridge
Nick ShucetCEO
Nick runs Full Circle day to day: the account teams, the operating system behind them, and the AI agents now handling daily reporting and PPC checks across the brands we manage.
Nothing gets recommended for your brand that his teams aren't already doing for brands at your level. If it's in your plan, someone on his team has run it before.
CEOruns Full Circle day to day
45brands his teams manage
AIdaily reporting and PPC checks
How it starts
Three steps. No guesswork.
01
Free brand diagnostic
A true Amazon expert digs into your account before the call and shows you the one constraint holding growth back.
02
Your 120-day plan
Targets, priorities and owners for your first 120 days, built around that constraint and the big moments ahead.
03
Run it. Watch it in Orbit.
Your expert and the AI run the plan every day. You watch it live in Orbit: the morning brief, sales, pacing and the reason for every move.
The Full Circle family
One circle. Every rung.
Software, media or a whole team. Every exit is a lateral move: you never outgrow the family, you move sideways.
The whole Amazon channel, run by true Amazon experts and AI built on $500M+, as one team.
Choose Full Circle if you want one team to own the number.
FAQ
Straight answers.
What does Full Circle actually do?
We run your whole Amazon channel: advertising, listings and creative, catalog, inventory and supply chain, account health, reimbursements and brand protection. True Amazon experts and AI built on $500M+ in revenue managed, working as one team with one plan.
Who actually runs my account?
True Amazon experts. Your account is steered by our key account management team, led by 7-figure operators: people who have built and run 7-figure businesses themselves. They own your strategy, your targets and the big moments like Prime Day and Black Friday. Ava and Dr. PPC do the daily work underneath them.
How does the AI work?
Ava and Dr. PPC run on cutting-edge AI models, armed with the playbooks and data from $500M+ in Amazon revenue managed. They read your account every day and propose or make changes inside the guardrails your expert sets: approve every move, act inside guardrails, or run fully autonomous. Every move is logged with its reason.
Will I see what you're doing?
Yes. Every client gets Orbit, the same dashboard our team works from: live sales and profit, pacing to your goal, profit by product, Dr. PPC's analysis and a log of every change with the reason behind it.
What makes growth predictable?
A goal for every month, a daily read on where you'll land, and a team that acts on it the same day. We can't promise results, but we make sure you always know where you stand and what we're doing about it.
What size brands do you work with?
Established DTC and Amazon brands, usually doing $100K or more a month, from fast-growing challengers to category leaders.
What does it cost?
It depends on scope. We'll walk you through the options, with real numbers, on the diagnostic call.
Do I keep ownership of my accounts and data?
Yes. Your Seller Central, your ad accounts and your data stay yours.
Let's close the circle.
Book a free brand diagnostic. A true Amazon expert reviews your account before the call and shows you where the next stage of growth is, and the plan to get there.